How to change max database connections
Last edited: 4/8/2026
WARNING: Manually configuring the connection count hard codes it. This means if you upgrade or downgrade your database, the connection count will not auto-resize. You will have to make sure to manually update it.
Changing max database connections:
Each compute instance has a default direct connection and pooler connection settings. You can find the most recent settings in the compute docs:
| Compute Size | Direct Connections | Pooler Connections |
|---|---|---|
| Nano (free) | 60 | 200 |
| Micro | 60 | 200 |
| Small | 90 | 400 |
| Medium | 120 | 600 |
| Large | 160 | 800 |
| XL | 240 | 1,000 |
| 2XL | 380 | 1,500 |
| 4XL | 480 | 3,000 |
| 8XL | 490 | 6,000 |
| 12XL | 500 | 9,000 |
| 16XL | 500 | 12,000 |
Configuring direct connections limits#
Note: the Supavisor connection limits are hard-coded and cannot be changed without upgrading the compute size:
You can configure the maximum amount of connections that Postgres will tolerate with the Supabase CLI.
You can run the following commands:
1npx supabase login23npx supabase --experimental --project-ref <PROJECT REF> postgres-config update --config max_connections=<INTEGER VALUE>Then you could run the following SQL in the SQL Editor to see if the changes went through:
1SHOW max_connections;Dangers of increasing the direct connection limits
Three factors must be taken into consideration when adjusting the direct connection limit:
Process schedulers and Postgres internals:#
Allowing too many direct connections in your database can overburden Postgres schedulers and other internal modules. This will result in a noticeable decrease in query throughput, despite having more connections available. EnterpriseDB wrote a wonderful article that outlines some of the considerations.
The default connection values are set based on a solid understanding of Postgres architecture, and straying too far from them is likely to hinder performance. However, with some experimentation, you might discover a value better suited to your specific needs. Still, unless there's a compelling reason to adjust the setting, it's generally advisable to stick with the defaults or change the values judiciously.'
Memory#
If you do not know how to monitor memory and CPU with Supabase Grafana, check here.
Each direct connection is a running process that will consume active memory#
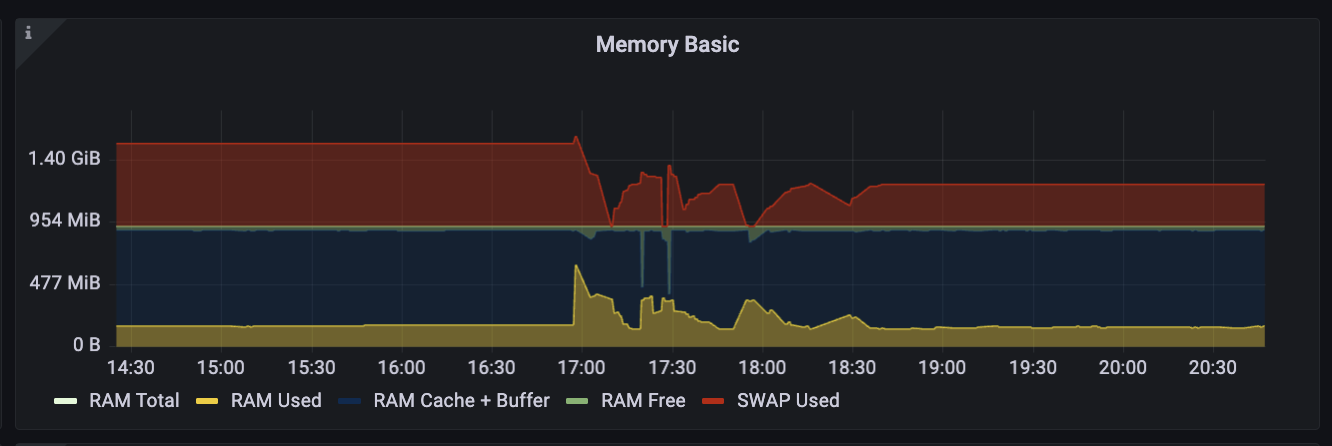
This is a Grafana Chart of unhealthy memory usage:

- Yellow: represents active memory
- Red: represents SWAP, which is disk storage that the system treats as if it were actually memory
- Green: it is unclaimed (the system will always leave some memory unclaimed)
- Blue: it is cached data and a buffer
The cache in Postgres is important because the database will store frequently accessed data in it for rapid retrieval. If too much active memory is needed, it runs the risk of excessively displacing cache. This will force queries to check disk, which is slow.
Most data in a database is idle. However, when there is little available memory or uncached data is rapidly accessed, thrashing can occur.
To avoid displacing cache or straining system resources, it is advised to not increase your direct connections unless you have a clear excess of unclaimed memory (green).
Postgres will allow you to overcommit memory. You can run the below query to find out the hypothetical max value you could change it to without risking memory failure:
NOTE: You can find your server memory in the compute add-ons docs
1select2 '(SERVER MEMORY - ' || current_setting('shared_buffers') || ' - (' || current_setting(3 'autovacuum_max_workers'4 ) || ' * ' || current_setting('maintenance_work_mem') || ')) / ' || current_setting('work_mem');CPU#
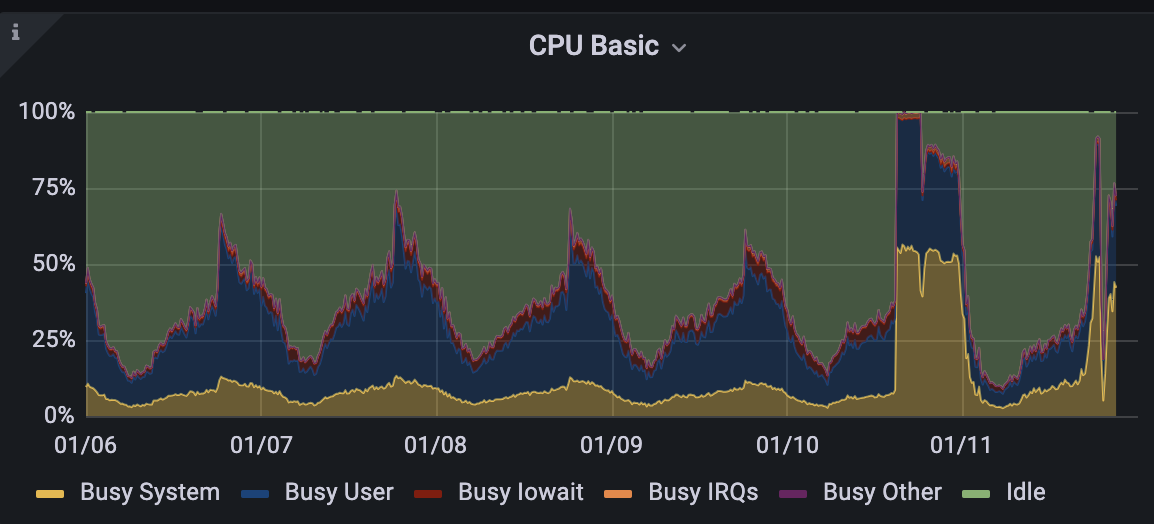
The below chart is an example of what can occur to the CPU if 100s of connections are inappropriately opened/closed every second or many CPU intensive queries are run in parallel

If you plan on increasing your direct connection numbers, your database should have relatively predictable or low CPU usage, such as what the example displays below: