Understanding PostgreSQL EXPLAIN Output
Last edited: 9/9/2025
Introduction
This guide is designed to help you understand how to use the Postgres EXPLAIN and EXPLAIN ANALYZE commands to optimize and debug SQL queries. Understanding the output of these commands can help you improve the performance of your applications by optimizing database interactions.
What is explain?
The Postgres EXPLAIN command shows the execution plan of a SQL query. This plan describes how the Postgres database will execute the query, including how tables will be scanned—by using sequential scans, index scans, etc.—and how rows will be joined.
How to use explain in Supabase
Using EXPLAIN through the SQL Editor
- Access your Supabase project
- Open the SQL editor
- Execute EXPLAIN with Your Query:
EXPLAIN SELECT * FROM users WHERE user_id = 1;
Using EXPLAIN with supabase-js Library
- Follow the Performance Debugging Guide to enable the functionality on your project.
- Once debugging is enabled, you can use the EXPLAIN function in your application code. Here's how to use it
1const { data, error } = await supabase2 .from('countries')3 .select()4 .explain({analyze:true,verbose:true})Detailed breakdown of explain output components
1. Plan type
- Seq Scan: A sequential scan that reads all rows from a table. This is often seen in the absence of indexes that can be used for the query.
- Index Scan: Uses an index to find rows quickly. This indicates that the query is able to use an index to efficiently locate data.
- Bitmap Heap Scan: Uses a bitmap index to find rows quickly and then retrieves the actual rows from the table. This type of scan is efficient when retrieving a moderate number of rows.
2. Cost
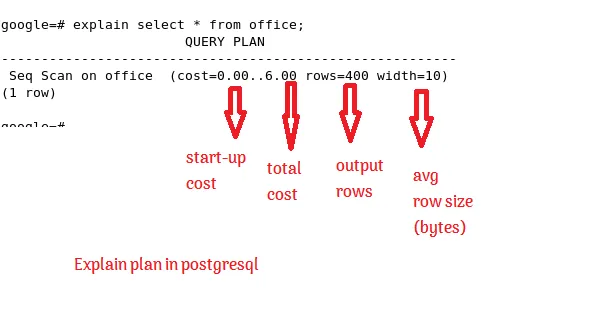
cost=0.00..19.00: This represents the estimated cost of executing the plan. The first number (0.00) is the cost of returning the first row, and the second number (19.00) is the total cost of executing the query and retrieving all rows. These values are arbitrary units determined by the database's cost model, not actual time or resources.
Start-up Cost: The cost incurred before returning the first row. Total Cost: The estimated total cost of the operation.
3. Rows
rows=1: An estimate of the number of rows the query will return. Accurate row estimates depend on updated statistics; if the estimates are off, it might indicate that the database statistics need to be updated.
4. Width
width=240: The average number of bytes expected for the output rows. This indicates the expected data volume that needs to be processed or transferred, which can impact performance.
5. Filters
Filter: (user_id = 1): This shows any filters applied post-scan. Filters are conditions that are checked after retrieving the rows. A high number of rows being filtered out could indicate a need for better indexing.
6. Execution time
Execution Time: 0.069 ms: measures how long it took to actually execute the query, including retrieving the data, performing any sorts, joins, or other operations defined in the execution plan, and returning the final results. This time is measured in milliseconds.

Detailed components in explain analyze
When running EXPLAIN ANALYZE, additional information is provided, including:
-
Actual time: Shows the time actually spent executing the scan and retrieving rows. This is split into the time to retrieve the first row (first) and the time to retrieve all rows (last).
-
Rows removed by filter: Indicates how many rows were excluded due to not meeting the filter conditions.
-
Loops: Shows how many times the node was executed, especially relevant in nested loop joins or subqueries.
Example of Detailed EXPLAIN ANALYZE Output
1Seq Scan on users (cost=0.00..19.00 rows=1 width=240) (actual time=0.026..0.026 rows=1 loops=1)2 Filter: (user_id = 1)3 Rows Removed by Filter: 9994Planning Time: 0.135 ms-
actual time=0.026..0.026: The time it took to start returning rows and to finish returning all rows.
-
Rows Removed by Filter: 999: Indicates that many rows were checked against the filter, but most did not match the criteria.
-
Planning Time: 0.135 ms: Planning Time refers to the amount of time the Postgres query planner takes to analyze the query and create an execution plan. This time is measured in milliseconds.
You might be asking yourself now, why there is two different sets of metrics : (cost=0.42..2.64 rows=1 width=164) (actual time=0.020..0.021 rows=1 loops=1)?
To answer you, one is for the estimated cost and performance, and another for the actual performance of the query as explained above.
Planning vs. Execution: The estimates are based on the query planner's understanding of the data (gathered from statistics about table size, distribution of values, etc.), while the actual metrics tell you what really happened when the query ran. This comparison can highlight inaccuracies in the planner's assumptions.
Performance Tuning: By comparing estimated rows and actual rows, or estimated time and actual time, you can identify potential performance issues. For example, if the estimated rows are significantly off from the actual rows, it might suggest that the table statistics are outdated, leading to inefficient query plans.
Identifying Bottlenecks: If the actual time is significantly higher than expected, or if loops are more frequent than anticipated, these could be indicators of performance bottlenecks in the query.
How to read a complex explain output
First, you have to understand that a Postgres execution plan is a tree structure consisting of several nodes. The top node (the Aggregate above) is at the top, and lower nodes are indented and start with an arrow (->). Nodes with the same indentation are on the same level (for example, the two relations combined with a join).
Here's an example:
1Aggregate Node (Top Node)2│3└──> Sort Node4 │5 └──> Hash Join Node6 │7 ├──> Seq Scan on users (Filtered)8 │9 └──> Hash10 │11 └──> Seq Scan on activitiesPostgres executes a plan top down, that is, it starts with producing the first result row for the top node. The executor processes lower nodes “on demand”, that is, it fetches only as many result rows from them as it needs to calculate the next result of the upper node. This influences how you have to read “cost” and “time”: the startup time for the upper node is at least as high as the startup time of the lower nodes, and the same holds for the total time. If you want to find the net time spent in a node, you have to subtract the time spent in the lower nodes. Parallel queries make that even more complicated.
On top of that, you have to multiply the cost and the time with the number of “loops” to get the total time spent in a node.
Common nodes in Postgres explain output
| Node Type | Description |
|---|---|
| Seq Scan | Scans each row of a table sequentially, often used without suitable indexes. |
| Index Scan | Uses an index to quickly find rows, efficient for small fractions of rows. |
| Index Only Scan | Retrieves all needed data from the index itself, without visiting the table. |
| Bitmap Heap Scan | Uses a bitmap of row locations to efficiently retrieve rows from the table. |
| Bitmap Index Scan | Builds a bitmap by scanning the index to efficiently locate rows. |
Tid Scan | Fetches rows directly using tuple identifiers, used in sub-selects. |
| Nested Loop | Joins two tables by scanning the first and then the second for each row. |
| Merge Join | Joins two pre-sorted tables, efficient for large datasets. |
| Hash Join | Uses a hash table to perform joins, often faster for larger datasets. |
| Aggregate | Performs aggregation calculations like SUM, COUNT, etc. |
| Sort | Sorts rows based on specified criteria, required for certain operations. |
| Limit | Returns a specified number of rows quickly, used with LIMIT clause. |
| CTE Scan | Scans a Common Table Expression, used for WITH clauses. |
| Materialize | Materializes the result of a subquery or node to reuse without re-running. |
| Subquery Scan | Executes and provides the results of a subquery to the outer query. |
| Foreign Scan | Fetches data from foreign data sources outside the local database. |
| Function Scan | Retrieves results from a set-returning function. |
What to focus on in explain analyze output
- Find the nodes where most of the execution time was spent.
Hash Join (cost=100.00..200.00 rows=1000 width=50) (actual time=50.012..150.023 rows=1000 loops=1)Explanation: The actual time=50.012..150.023 indicates that this join operation took about 100 milliseconds to complete, making it a potential performance bottleneck. - Find the lowest node where the estimated row count is significantly different from the actual row count.
Seq Scan on users (cost=0.00..50.00 rows=100 width=50) (actual time=0.010..25.000 rows=10000 loops=1)Explanation: The estimated rows are 100, but the actual rows are 10,000. This discrepancy may lead the query planner to make inefficient choices, such as choosing a sequential scan over an index scan. - Find long-running sequential scans with a filter condition that removes many rows.
1Seq Scan on products (cost=0.00..100.00 rows=300 width=50) (actual time=50.000..100.000 rows=3 loops=1)2 Filter: (price > 1000)3 Rows Removed by Filter: 2997Explanation: This sequential scan took 50 to 100 milliseconds and filtered out 2997 of 3000 rows, indicating that only a few rows met the condition. This scenario is ideal for an index on the price column to optimize the performance by reducing the need for a full table scan.
Understanding the significance of milliseconds in Query Performance
Determining whether 100 milliseconds for e.g is noteworthy in the context of identifying performance bottlenecks depends on various factors:
Overall Query Execution Time:
If the total execution time of a query significantly exceeds 100 milliseconds, then this particular step may not represent the main bottleneck. For instance, in queries that take several seconds to execute, a component that consumes just 100 milliseconds may not be the critical target for optimization efforts.
Complexity and Scale of the Query:
For complex queries that involve multiple joins, subqueries, or aggregation functions, an operation that takes 100 milliseconds might actually reflect good efficiency. Conversely, for simpler queries or operations expected to be quick (such as fetching a few rows from a well-indexed table), 100 milliseconds could suggest a lack of efficiency.
So, the acceptable performance threshold can vary by application. For real-time systems or high-frequency trading platforms, even a few milliseconds can be critical, whereas for batch processing or data warehousing, longer execution times might be acceptable.
Tools to interpret explain analyze output
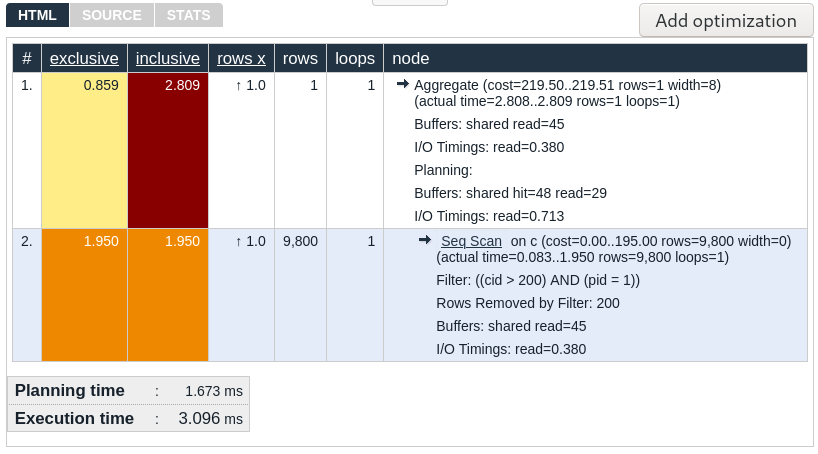
Since reading a longer execution plan is quite cumbersome, you can use the website https://explain.depesz.com/ to better visualize the query. If you paste the execution plan in the text area and hit “Submit”, you will get output like this:

Tips for optimizing queries
-
Add Indexes: Improve performance by adding indexes on columns that are frequently used in WHERE clauses or JOIN conditions.
-
Avoid Selecting Unused Columns: Use SELECT to specify only the columns you need.
-
Update Statistics: Ensure that statistics are up to date to help the optimizer make better choices.
Conclusion
Understanding EXPLAIN and EXPLAIN ANALYZE output can significantly enhance your ability to write efficient SQL queries. Regularly analyze query performance and make adjustments as your dataset grows and changes.
For more insights, you can also check out: https://aws.amazon.com/blogs/database/how-postgresql-processes-queries-and-how-to-analyze-them/.