Metrics API
Every Supabase project exposes a Prometheus-compatible Metrics API endpoint that surfaces ~200 Postgres performance and health series. You can scrape it into any observability stack to power custom dashboards, alerting rules, or long-term retention that goes beyond what Supabase Studio provides out of the box.
The Metrics API is currently in beta. Metric names and labels might evolve as we expand the dataset, and the feature is not available in self-hosted Supabase instances.
What you can do with the Metrics API#
- Stream database CPU, IO, WAL, connection, and query stats into Prometheus-compatible systems.
- Combine Supabase metrics with application signals in Grafana, Datadog, or any other observability vendor.
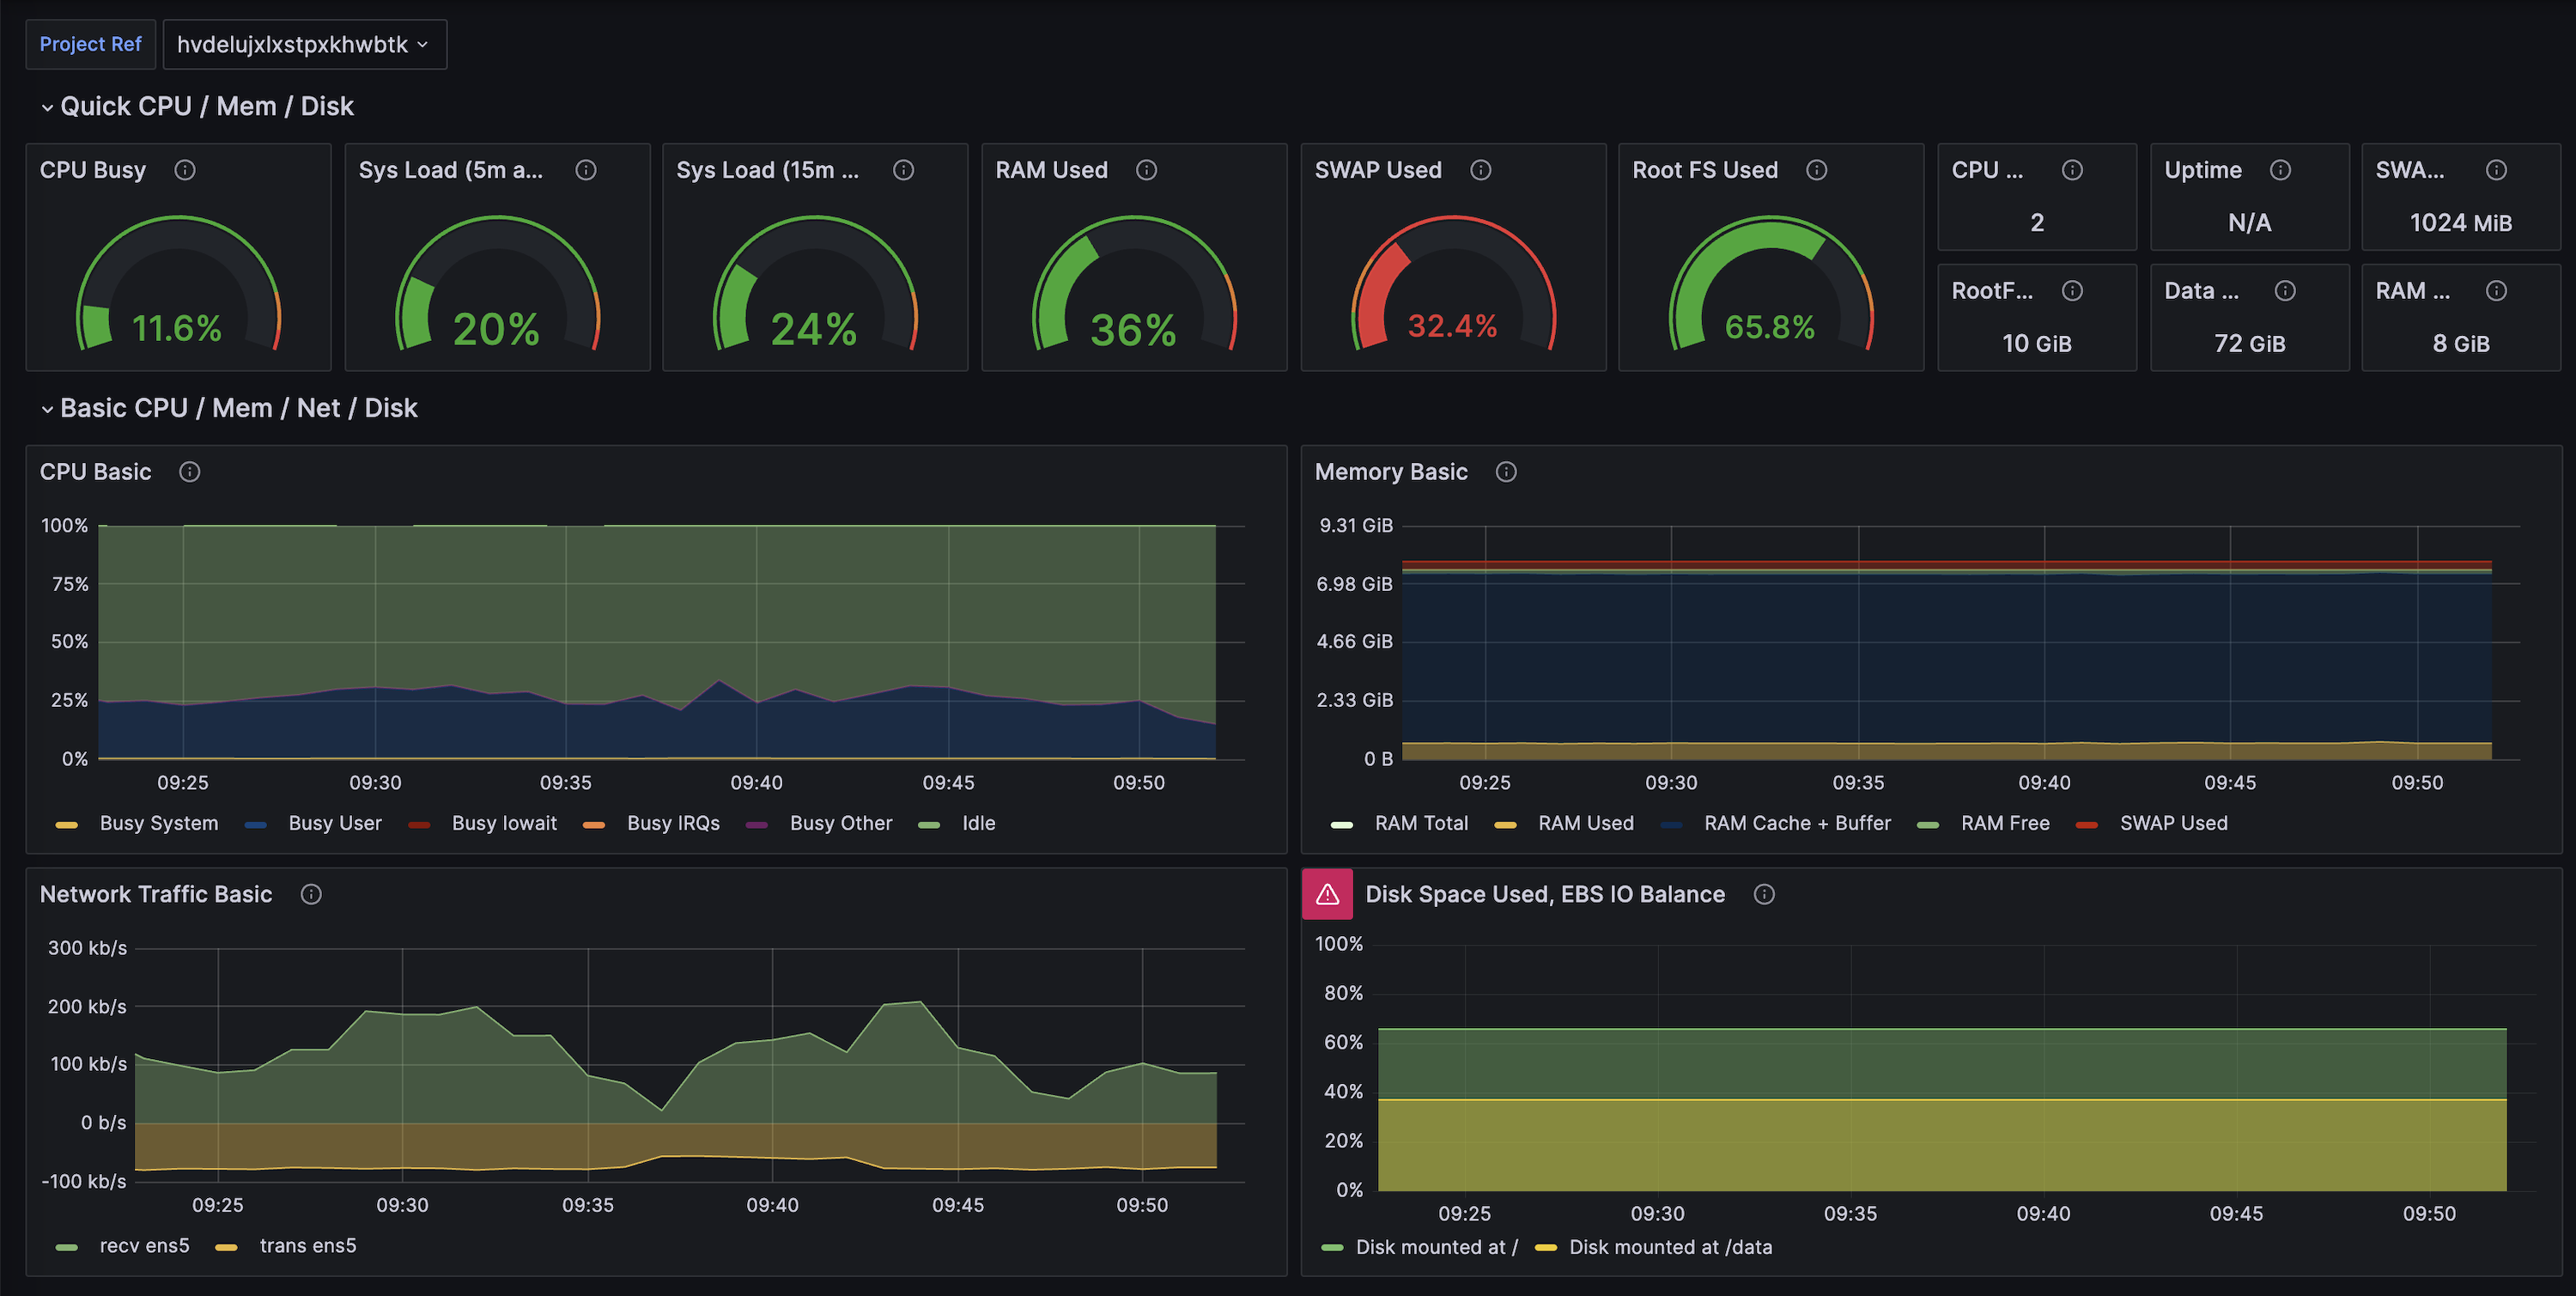
- Reuse our supabase-grafana dashboard JSON to bootstrap over 200 ready-made charts.
- Build your own alerting policies (right-sizing, saturation detection, index regression, and more).
Choose your monitoring stack#
Pick the workflow that best matches your tooling. Cards link to Supabase-authored guides or vendor integration docs, and some include a “Community” pill when there’s an accompanying vendor reference.
Grafana Cloud (SaaS)
Grafana + self-hosted Prometheus
Datadog
Vendor-agnostic / BYO Prometheus
Additional resources#
- Supabase Grafana repository for dashboard JSON and alert examples.
- Grafana Cloud’s Supabase integration doc (community-maintained, built on this Metrics API).
- Datadog’s Supabase integration doc (community-maintained, built on this Metrics API).
- Log Drains for exporting event-based telemetry alongside metrics.
- Query Performance report for built-in visualizations based on the same underlying metrics.