Interpreting Supabase Grafana IO charts
Last edited: 6/15/2026
There are two primary values that matter for IO:
- Disk Throughput: how much data can be moved to and from disk per second
- IOPS(Input/Output per second): how many read/write requests can be performed against your disk per second
Each compute instance has unique IO settings. The current baseline (sustained) and max (burst) limits are listed below.
| Compute Instance | Baseline Throughput (MB/s) | Max Throughput (MB/s) | Baseline IOPS | Max IOPS |
|---|---|---|---|---|
| Nano (free) | 5 MB/s | 261 MB/s | 250 IOPS | 11,800 IOPS |
| Micro | 11 MB/s | 261 MB/s | 500 IOPS | 11,800 IOPS |
| Small | 22 MB/s | 261 MB/s | 1,000 IOPS | 11,800 IOPS |
| Medium | 43 MB/s | 261 MB/s | 2,000 IOPS | 11,800 IOPS |
| Large | 79 MB/s | 594 MB/s | 3,600 IOPS | 20,000 IOPS |
| XL | 149 MB/s | 594 MB/s | 6,000 IOPS | 20,000 IOPS |
| 2XL | 297 MB/s | 594 MB/s | 12,000 IOPS | 20,000 IOPS |
| 4XL | 594 MB/s | 594 MB/s | 20,000 IOPS | 20,000 IOPS |
| 8XL | 1,188 MB/s | 1,188 MB/s | 40,000 IOPS | 40,000 IOPS |
| 12XL | 1,781 MB/s | 1,781 MB/s | 50,000 IOPS | 50,000 IOPS |
| 16XL | 2,375 MB/s | 2,375 MB/s | 80,000 IOPS | 80,000 IOPS |
| 24XL | 3,750 MB/s | 3,750 MB/s | 120,000 IOPS | 120,000 IOPS |
| 24XL - Optimized CPU | 3,750 MB/s | 3,750 MB/s | 120,000 IOPS | 120,000 IOPS |
| 24XL - Optimized Memory | 3,750 MB/s | 3,750 MB/s | 120,000 IOPS | 120,000 IOPS |
| 24XL - High Memory | 3,750 MB/s | 3,750 MB/s | 120,000 IOPS | 120,000 IOPS |
| 48XL | 5,000 MB/s | 5,000 MB/s | 240,000 IOPS | 240,000 IOPS |
| 48XL - Optimized CPU | 5,000 MB/s | 5,000 MB/s | 240,000 IOPS | 240,000 IOPS |
| 48XL - Optimized Memory | 5,000 MB/s | 5,000 MB/s | 240,000 IOPS | 240,000 IOPS |
| 48XL - High Memory | 5,000 MB/s | 5,000 MB/s | 240,000 IOPS | 240,000 IOPS |
Compute sizes below XL can burst above baseline for short periods before returning back to their baseline behavior.
There are other metrics that indicate IO strain.
This example shows a 16XL database exhibiting severe IO strain:
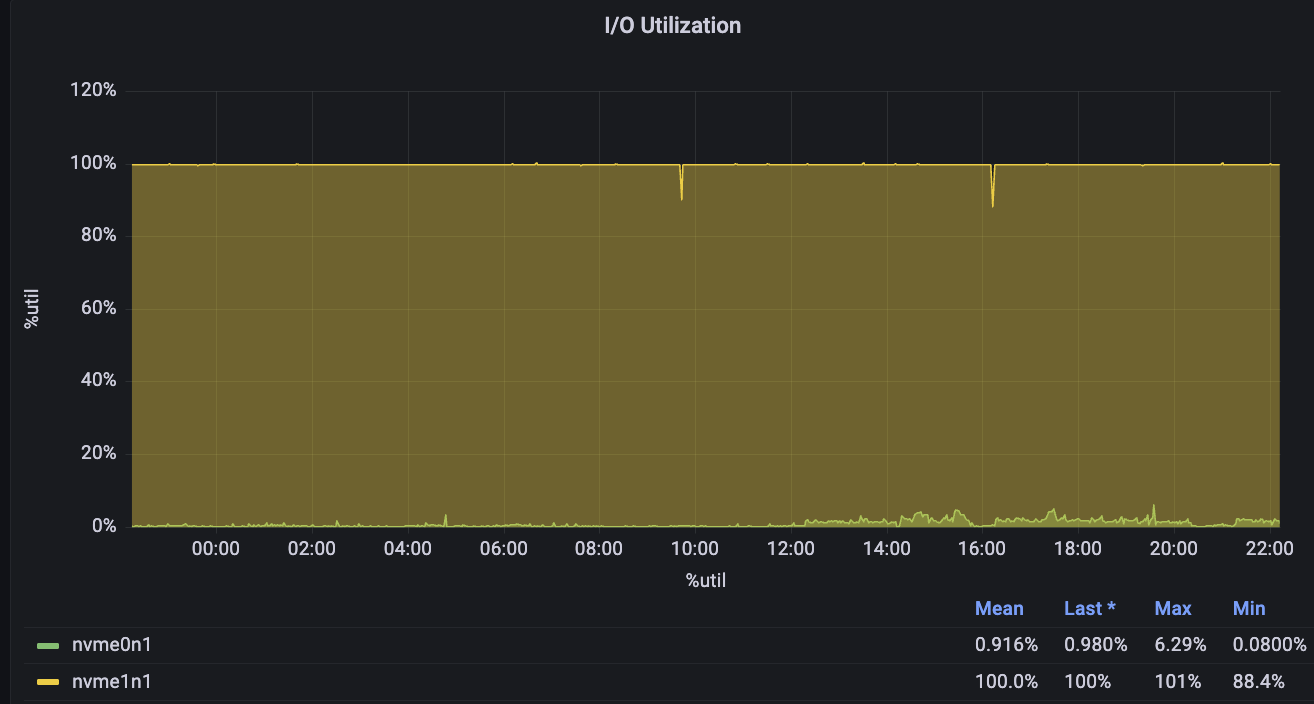
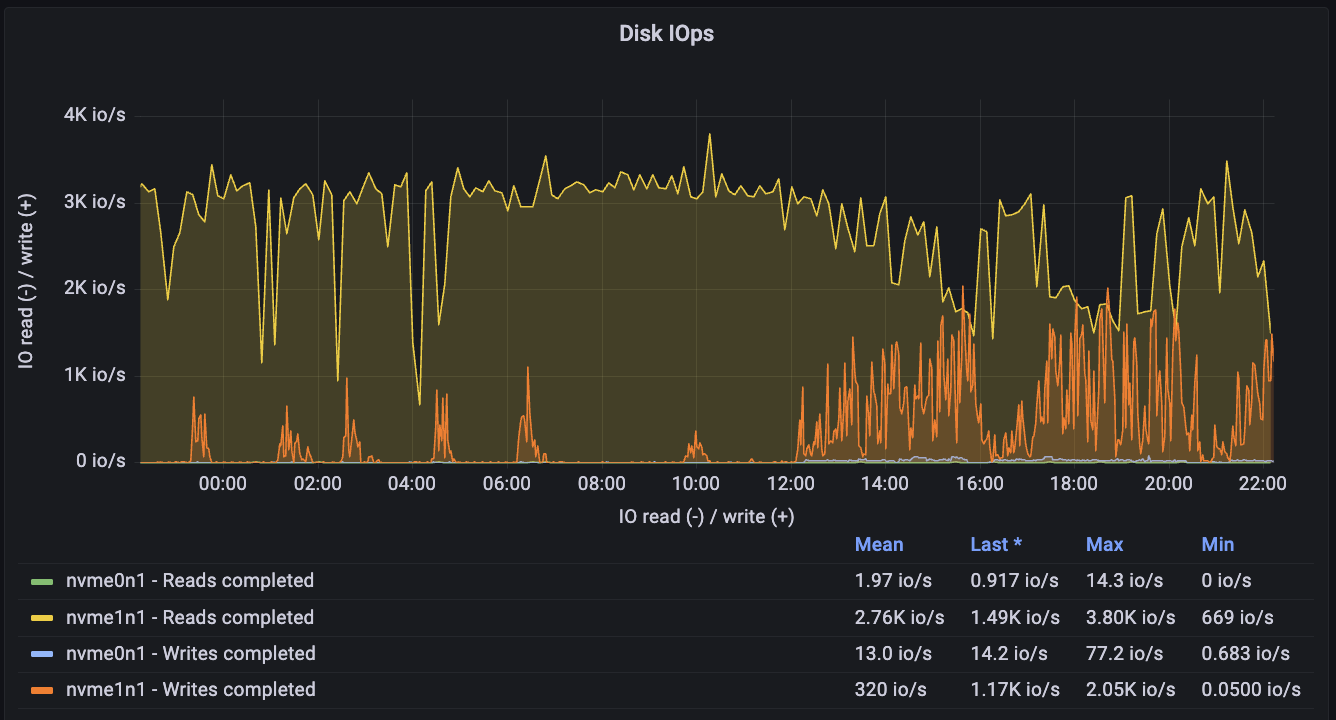
Its Disk IOPS is constantly near peak capacity:
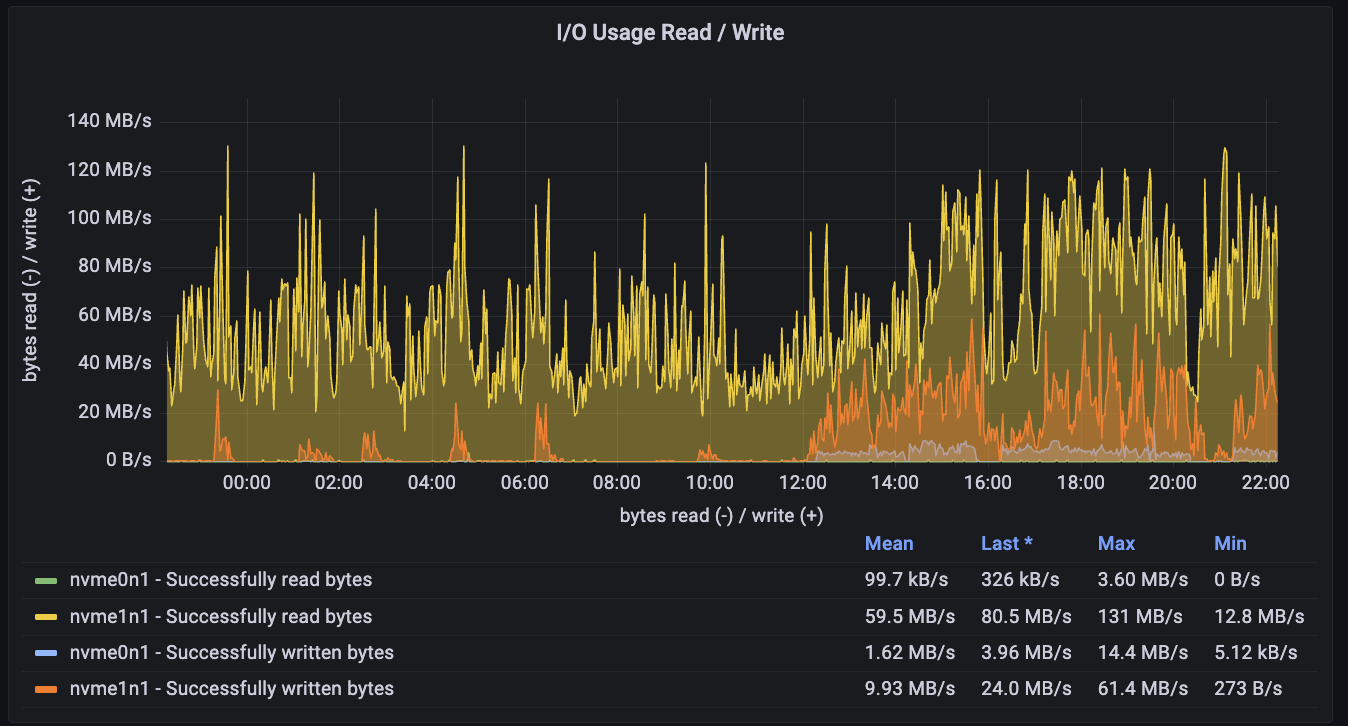
Its throughput is also high:
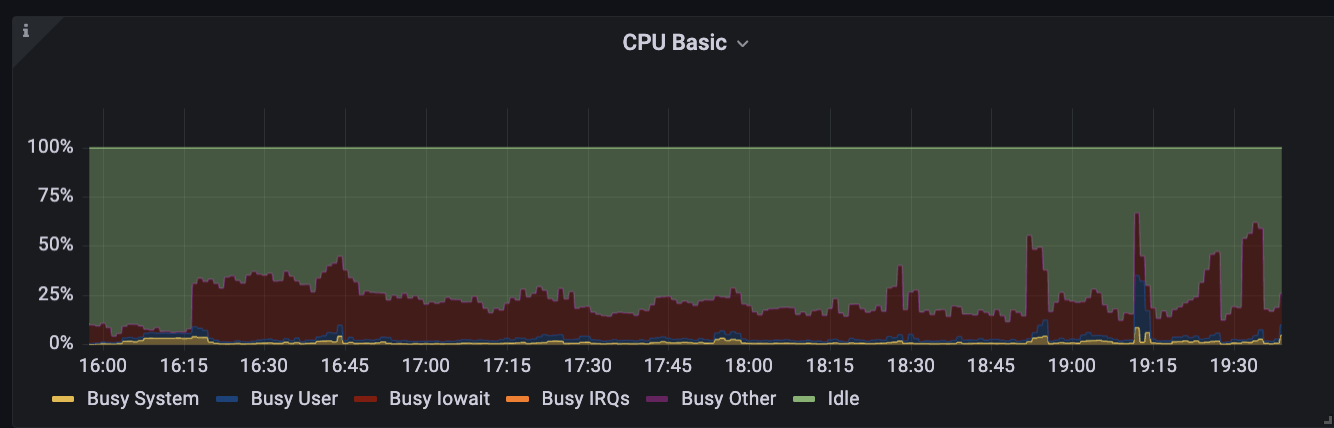
As a side-effect, its CPU is encumbered by heavy Busy IOWait activity:
Excessive IO usage is highly problematic as it clarifies that your database is expending more IO than it normally is intended to manage. This can be caused by
- Excessive and needless sequential scans: poorly indexed tables force requests to scan disk (guide to resolve)
- Too little cache: There is not enough memory, so instead of reading data from the memory cache, it is accessed from disk (guide to inspect)
- Poorly optimized RLS policies: RLS that rely heavily on joins are more likely to hit disk. If possible, they should optimized (RLS best practice guide)
- Excessive bloat: This is the least likely to cause major issues, but bloat can take up space, preventing data on disk from being placed in the same locality. This can force the database to scan more pages than necessary. (explainer guide)
- Uploading high amounts of data: temporarily increase compute add-on size for the duration of the uploads
- Insufficient memory: Sometimes an inadequate amount of memory forces queries to hit disk instead of the memory cache. Address memory issues (guide) can reduce disk strain.
If a database exhibited some of these metrics for prolonged periods, then there are a few primary approaches:
- Scale the database to get more IO if possible
- Optimize queries/tables or refactor database/app to reduce IO
- Spin-up a read-replica
- Modify IO configs in the Compute and Disk settings
- Partitions: Generally should be used on very large tables to minimize data pulled from disk
Other useful Supabase Grafana guides:
Esoteric factors#
Webhooks:
Supabase webhooks use the pg_net extension to handle requests. The net.http_request_queue table isn't indexed to keep write costs low. However, if you upload millions of rows to a webhook-enabled table too quickly, it can significantly increase the read costs for the extension.
To check if reads are becoming expensive, run:
1select count(*) as exact_count from net.http_request_queue;2-- the number should be relatively low <20,000If you encounter this issue, you can either:
-
Increase your compute size to help handle the large volume of requests.
-
Truncate the table to clear the queue:
1TRUNCATE net.http_request_queue;