Logging
The Supabase Platform includes a Logs Explorer that allows log tracing and debugging. Log retention is based on your project's pricing plan.
Product logs#
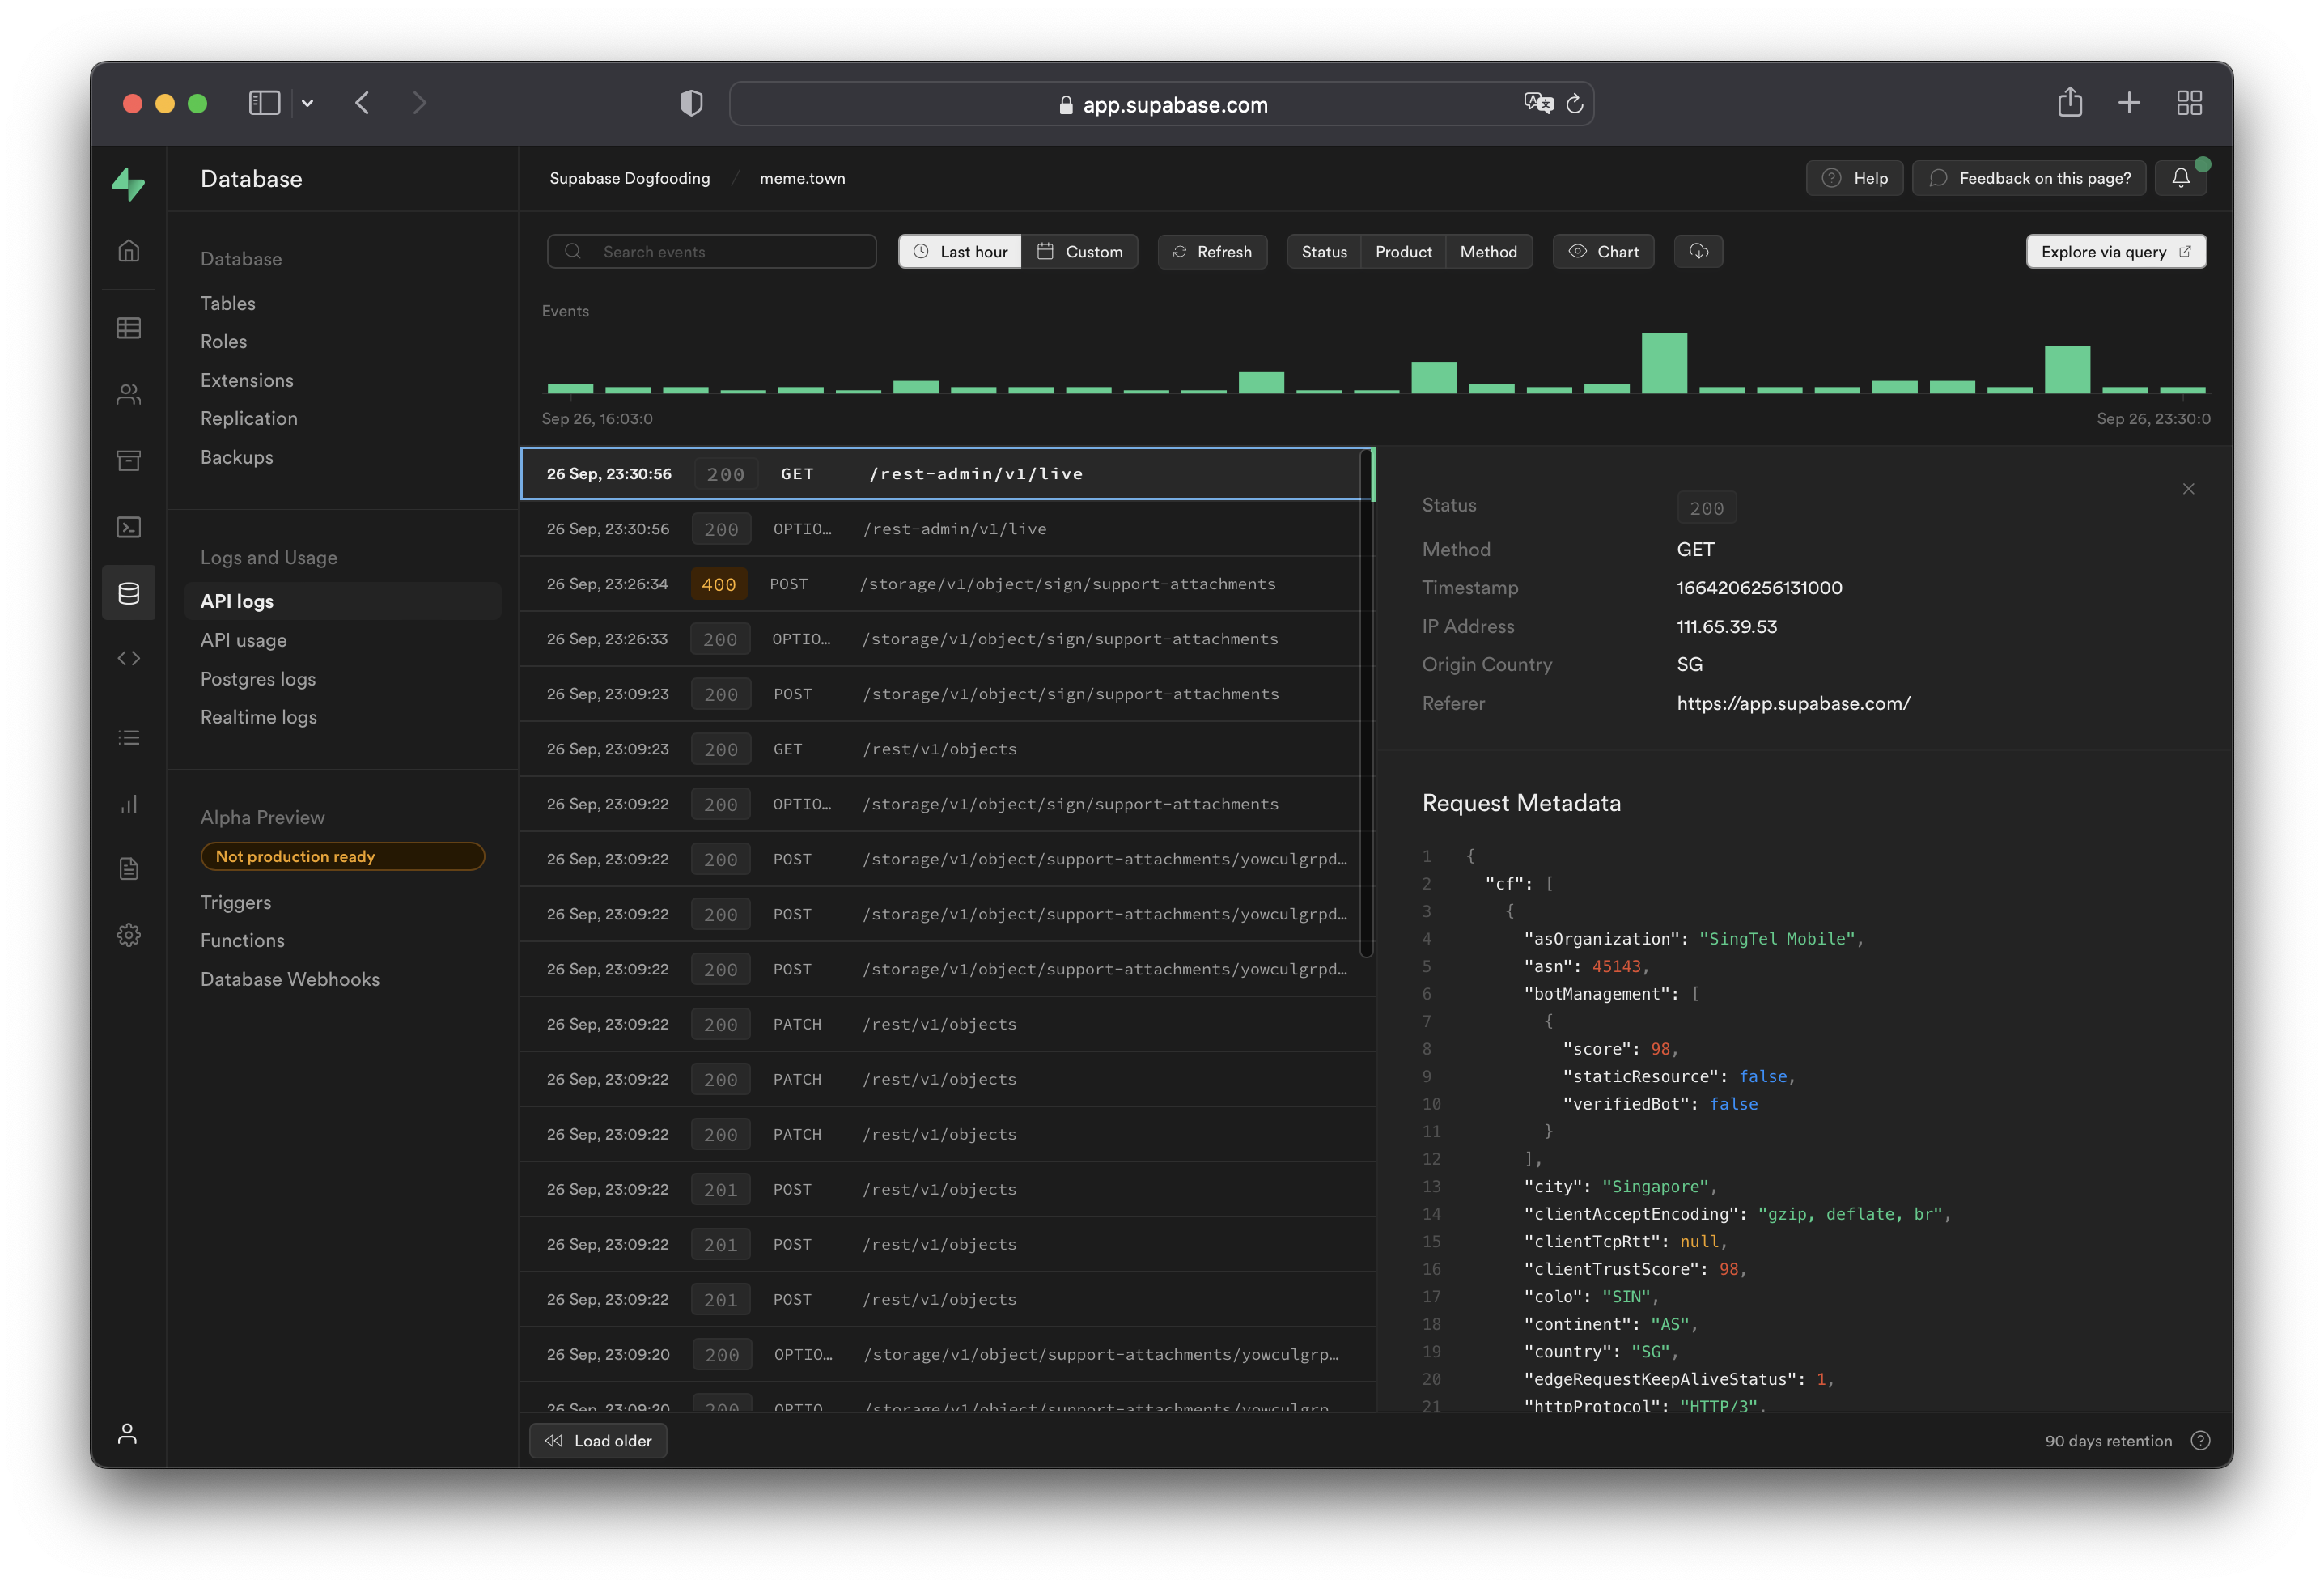
Supabase provides a logging interface specific to each product. You can use simple regular expressions for keywords and patterns to search log event messages. You can also export and download the log events matching your query as a spreadsheet.
API logs show all network requests and response for the REST and GraphQL APIs. If Read Replicas are enabled, logs are automatically filtered between databases as well as the API Load Balancer endpoint. Logs for a specific endpoint can be toggled with the Source button on the upper-right section of the dashboard.
When viewing logs originating from the API Load Balancer endpoint, the upstream database or the one that eventually handles the request can be found under the Redirect Identifier field. This is equivalent to metadata.load_balancer_redirect_identifier when querying the underlying logs.

Working with API logs#
API logs run through the Cloudflare edge servers and will have attached Cloudflare metadata under the metadata.request.cf.* fields.
Allowed headers#
A strict list of request and response headers are permitted in the API logs. Request and response headers will still be received by the server(s) and client(s), but will not be attached to the API logs generated.
Request headers:
acceptcf-connecting-ipcf-ipcountryhostuser-agentx-forwarded-protoreferercontent-lengthx-real-ipx-client-infox-forwarded-user-agentrangeprefer
Response headers:
cf-cache-statuscf-raycontent-locationcontent-rangecontent-typecontent-lengthdatetransfer-encodingx-kong-proxy-latencyx-kong-upstream-latencysb-gateway-modesb-gateway-version
Additional request metadata#
To attach additional metadata to a request, it is recommended to use the User-Agent header for purposes such as device or version identification.
For example:
1node MyApp/1.2.3 (device-id:abc123)2Mozilla/5.0 (Windows NT 6.1; Win64; x64; rv:47.0) Gecko/20100101 Firefox/47.0 MyApp/1.2.3 (Foo v1.3.2; Bar v2.2.2)Do not log Personal Identifiable Information (PII) within the User-Agent header, to avoid infringing data protection privacy laws. Overly fine-grained and detailed user agents may allow fingerprinting and identification of the end user through PII.
Logging Postgres queries#
To enable query logs for other categories of statements:
- Enable the pgAudit extension.
- Configure
pgaudit.log(see below). Perform a fast reboot if needed. - View your query logs under Logs > Postgres Logs.
Configuring pgaudit.log#
The stored value under pgaudit.log determines the classes of statements that are logged by pgAudit extension. Refer to the pgAudit documentation for the full list of values.
To enable logging for function calls/do blocks, writes, and DDL statements for a single session, execute the following within the session:
1-- temporary single-session config update2set pgaudit.log = 'function, write, ddl';To permanently set a logging configuration (beyond a single session), execute the following, then perform a fast reboot:
1-- equivalent permanent config update.2alter role postgres set pgaudit.log to 'function, write, ddl';To help with debugging, we recommend adjusting the log scope to only relevant statements as having too wide of a scope would result in a lot of noise in your Postgres logs.
Note that in the above example, the role is set to postgres. To log user-traffic flowing through the HTTP APIs powered by PostgREST, set your configuration values for the authenticator.
1-- for API-related logs2alter role authenticator set pgaudit.log to 'write';By default, the log level will be set to log. To view other levels, run the following:
1-- adjust log level2alter role postgres set pgaudit.log_level to 'info';3alter role postgres set pgaudit.log_level to 'debug5';Note that as per the pgAudit log_level documentation, error, fatal, and panic are not allowed.
To reset system-wide settings, execute the following, then perform a fast reboot:
1-- resets stored config.2alter role postgres reset pgaudit.logIf any permission errors are encountered when executing alter role postgres ..., it is likely that your project has yet to receive the patch to the latest version of supautils, which is currently being rolled out.
RAISEd log messages in Postgres#
Messages that are manually logged via RAISE INFO, RAISE NOTICE, RAISE WARNING, and RAISE LOG are shown in Postgres Logs. Note that only messages at or above your logging level are shown. Syncing of messages to Postgres Logs may take a few minutes.
If your logs aren't showing, check your logging level by running:
1show log_min_messages;Note that LOG is a higher level than WARNING and ERROR, so if your level is set to LOG, you will not see WARNING and ERROR messages.
Logging realtime connections#
Realtime doesn't log new WebSocket connections or Channel joins by default. Enable connection logging per client by including an info log_level parameter when instantiating the Supabase client.
1import { createClient } from '@supabase/supabase-js'23const options = {4 realtime: {5 params: {6 log_level: 'info',7 },8 },9}10const supabase = createClient('https://xyzcompany.supabase.co', 'sb_publishable_...', options)Logs Explorer#
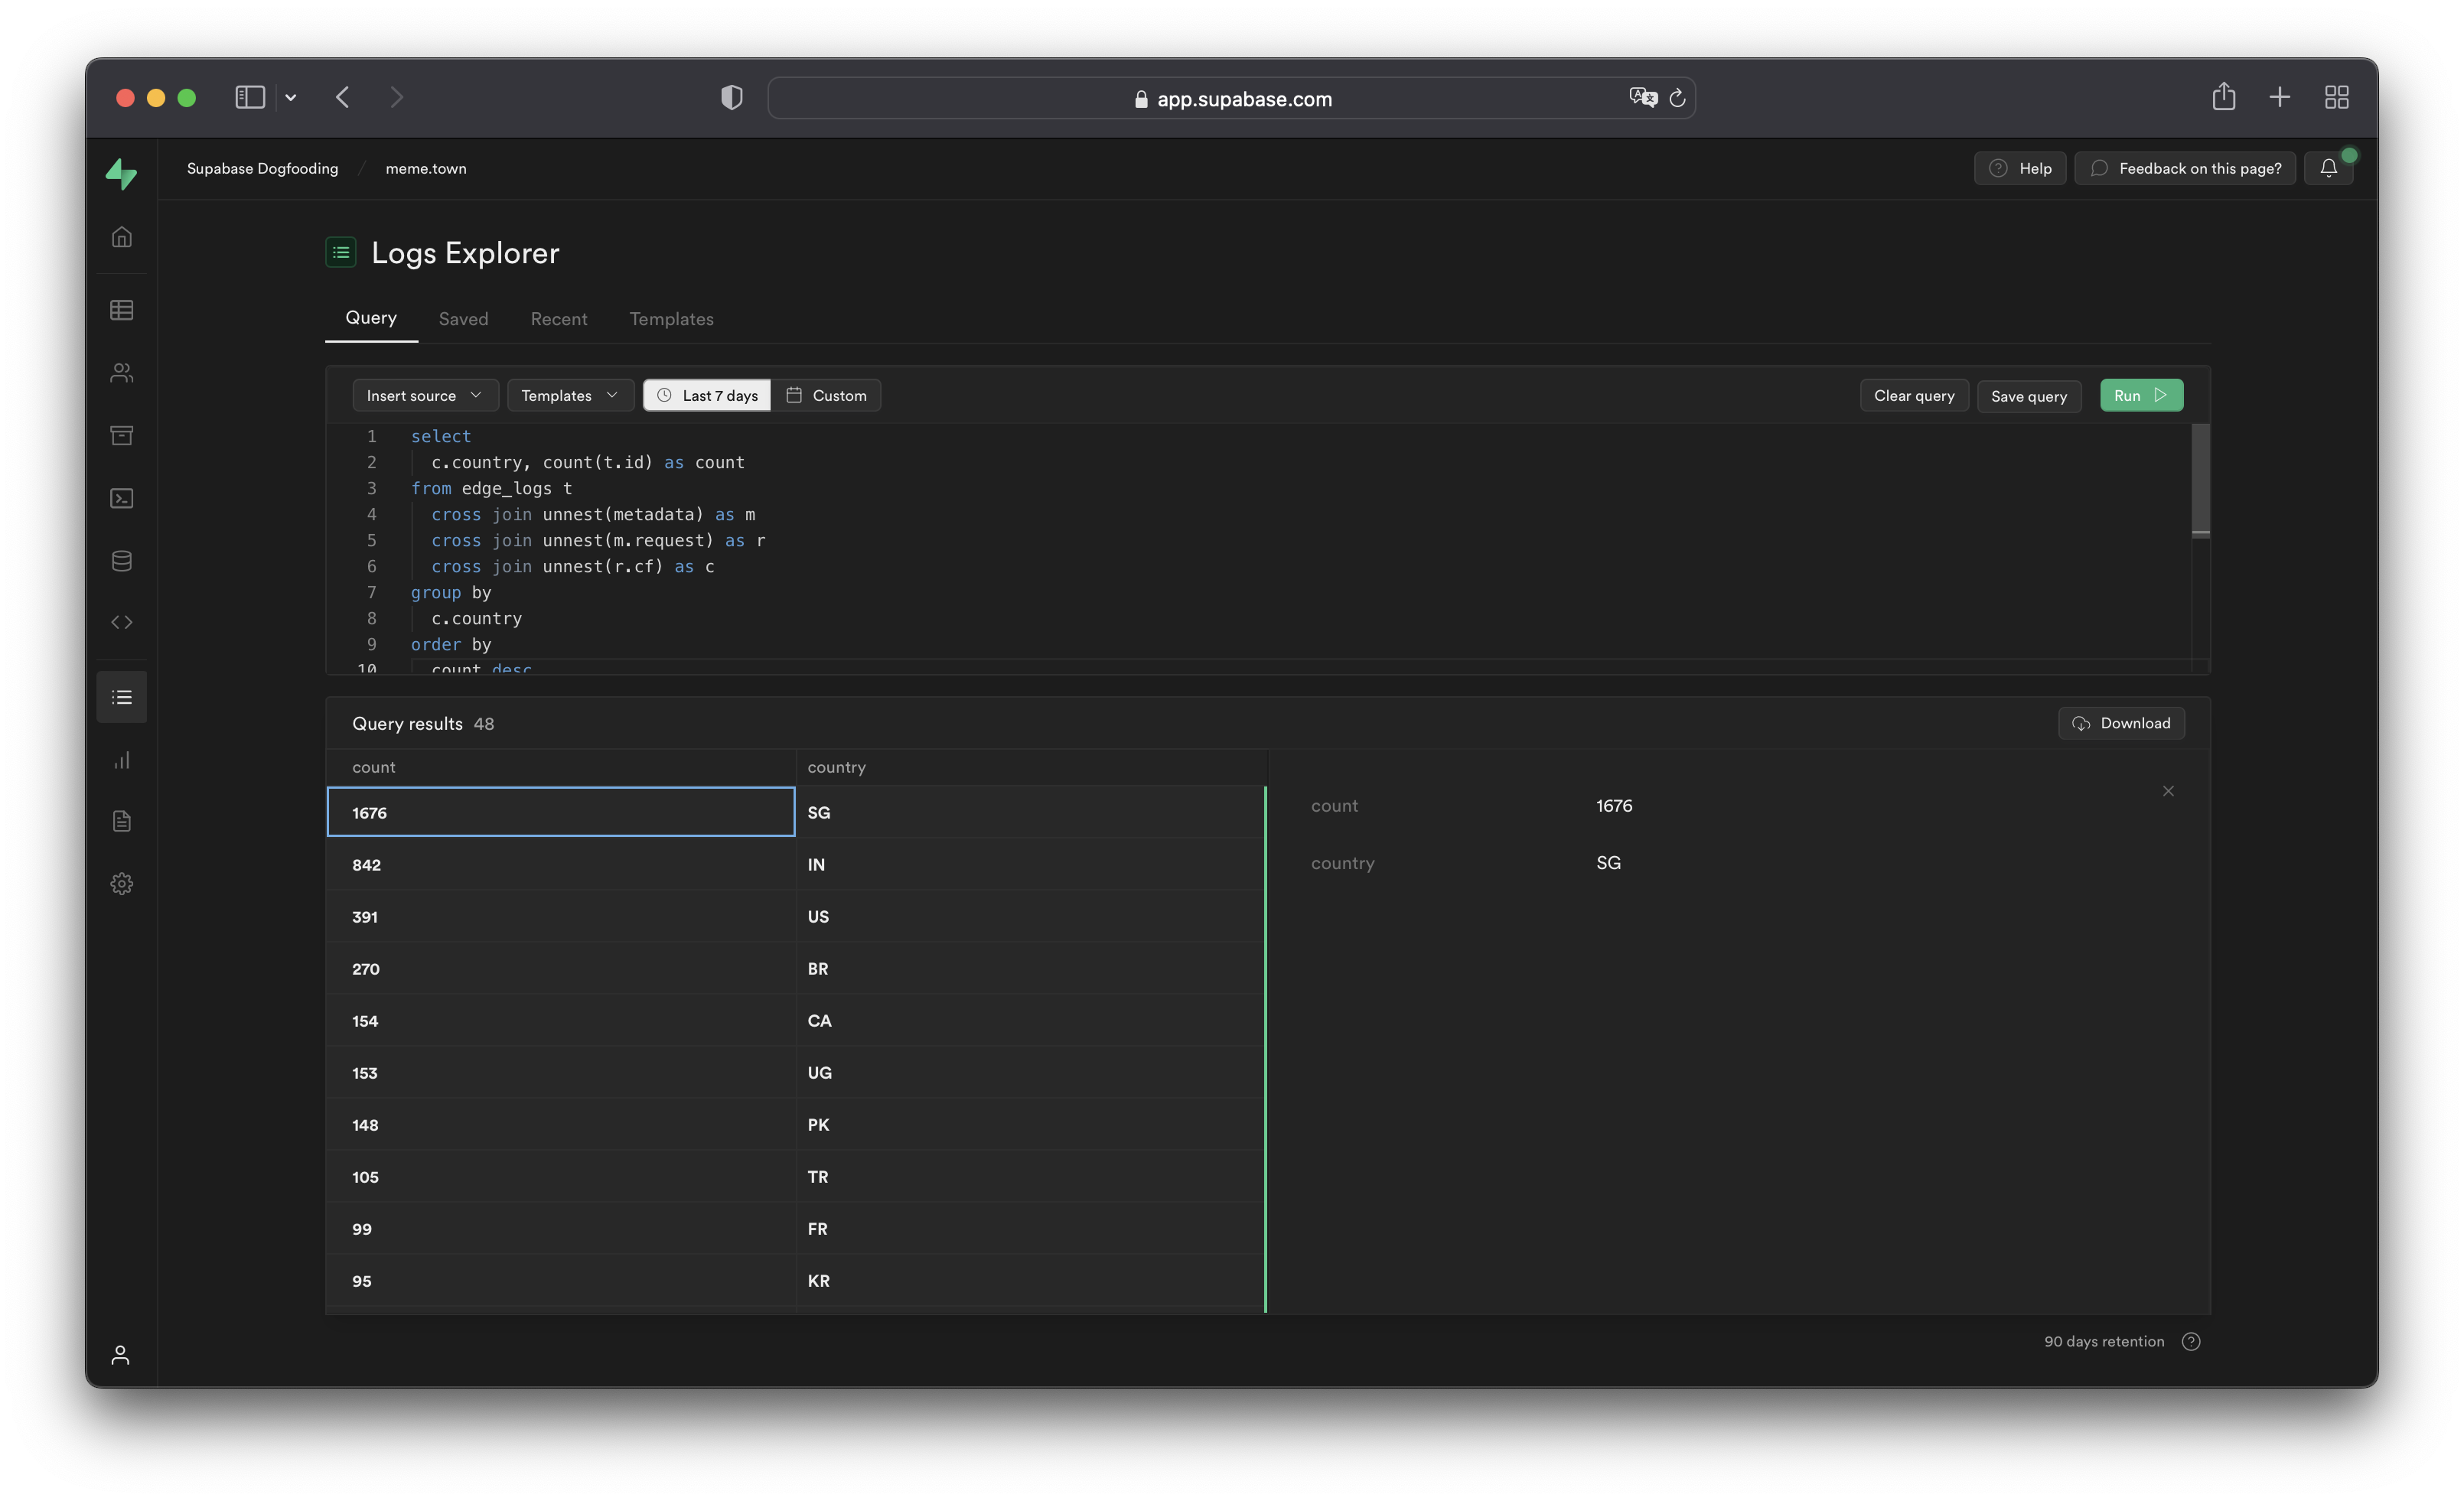
The Logs Explorer exposes logs from each part of the Supabase stack as a separate table that can be queried and joined using SQL.

You can access the following logs from the Sources drop-down:
auth_logs: GoTrue server logs, containing authentication/authorization activity.edge_logs: Edge network logs, containing request and response metadata retrieved from Cloudflare.function_edge_logs: Edge network logs for only edge functions, containing network requests and response metadata for each execution.function_logs: Function internal logs, containing anyconsolelogging from within the edge function.postgres_logs: Postgres database logs, containing statements executed by connected applications.realtime_logs: Realtime server logs, containing client connection information.storage_logs: Storage server logs, containing object upload and retrieval information.
Querying with the Logs Explorer#
The Logs Explorer uses BigQuery and supports all available SQL functions and operators.
Timestamp display and behavior#
Each log entry is stored with a timestamp as a TIMESTAMP data type. Use the appropriate timestamp function to utilize the timestamp field in a query.
Raw top-level timestamp values are rendered as unix microsecond. To render the timestamps in a human-readable format, use the DATETIME() function to convert the unix timestamp display into an ISO-8601 timestamp.
1-- timestamp column without datetime()2select timestamp from ....3-- 166427018000045-- timestamp column with datetime()6select datetime(timestamp) from ....7-- 2022-09-27T09:17:10.439ZUnnesting arrays#
Each log event stores metadata an array of objects with multiple levels, and can be seen by selecting single log events in the Logs Explorer. To query arrays, use unnest() on each array field and add it to the query as a join. This allows you to reference the nested objects with an alias and select their individual fields.
For example, to query the edge logs without any joins:
1select timestamp, metadata from edge_logs as t;The resulting metadata key is rendered as an array of objects in the Logs Explorer. In the following diagram, each box represents a nested array of objects:

Perform a cross join unnest() to work with the keys nested in the metadata key.
To query for a nested value, add a join for each array level:
1select timestamp, request.method, header.cf_ipcountry2from3 edge_logs as t4 cross join unnest(t.metadata) as metadata5 cross join unnest(metadata.request) as request6 cross join unnest(request.headers) as header;This surfaces the following columns available for selection:

This allows you to select the method and cf_ipcountry columns. In JS dot notation, the full paths for each selected column are:
metadata[].request[].methodmetadata[].request[].headers[].cf_ipcountry
LIMIT and result row limitations#
The Logs Explorer has a maximum of 1000 rows per run. Use LIMIT to optimize your queries by reducing the number of rows returned further.
Best practices#
- Include a filter over timestamp
Querying your entire log history might seem appealing. For Enterprise customers that have a large retention range, you run the risk of timeouts due additional time required to scan the larger dataset.
- Avoid selecting large nested objects. Select individual values instead.
When querying large objects, the columnar storage engine selects each column associated with each nested key, resulting in a large number of columns being selected. This inadvertently impacts the query speed and may result in timeouts or memory errors, especially for projects with a lot of logs.
Instead, select only the values required.
1-- ❌ Avoid doing this2select3 datetime(timestamp),4 m as metadata -- <- metadata contains many nested keys5from6 edge_logs as t7 cross join unnest(t.metadata) as m;89-- ✅ Do this10select11 datetime(timestamp),12 r.method -- <- select only the required values13from14 edge_logs as t15 cross join unnest(t.metadata) as m16 cross join unnest(m.request) as r;Examples and templates#
The Logs Explorer includes Templates (available in the Templates tab or the dropdown in the Query tab) to help you get started.
For example, you can enter the following query in the SQL Editor to retrieve each user's IP address:
1select datetime(timestamp), h.x_real_ip2from3 edge_logs4 cross join unnest(metadata) as m5 cross join unnest(m.request) as r6 cross join unnest(r.headers) as h7where h.x_real_ip is not null and r.method = "GET";Logs field reference#
Refer to the full field reference for each available source below. Do note that in order to access each nested key, you would need to perform the necessary unnesting joins
| Path | Type |
|---|---|
| id | string |
| timestamp | datetime |
| event_message | string |
| identifier | string |
| metadata.load_balancer_redirect_identifier | string |
| metadata.request.cf.asOrganization | string |
| metadata.request.cf.asn | number |
| metadata.request.cf.botManagement.corporateProxy | boolean |
| metadata.request.cf.botManagement.detectionIds | number[] |
| metadata.request.cf.botManagement.ja3Hash | string |
| metadata.request.cf.botManagement.score | number |
| metadata.request.cf.botManagement.staticResource | boolean |
| metadata.request.cf.botManagement.verifiedBot | boolean |
| metadata.request.cf.city | string |
| metadata.request.cf.clientTcpRtt | number |
| metadata.request.cf.clientTrustScore | number |
| metadata.request.cf.colo | string |
| metadata.request.cf.continent | string |
| metadata.request.cf.country | string |
| metadata.request.cf.edgeRequestKeepAliveStatus | number |
| metadata.request.cf.httpProtocol | string |
| metadata.request.cf.latitude | string |
| metadata.request.cf.longitude | string |
| metadata.request.cf.metroCode | string |
| metadata.request.cf.postalCode | string |
| metadata.request.cf.region | string |
| metadata.request.cf.timezone | string |
| metadata.request.cf.tlsCipher | string |
| metadata.request.cf.tlsClientAuth.certPresented | string |
| metadata.request.cf.tlsClientAuth.certRevoked | string |
| metadata.request.cf.tlsClientAuth.certVerified | string |
| metadata.request.cf.tlsExportedAuthenticator.clientFinished | string |
| metadata.request.cf.tlsExportedAuthenticator.clientHandshake | string |
| metadata.request.cf.tlsExportedAuthenticator.serverFinished | string |
| metadata.request.cf.tlsExportedAuthenticator.serverHandshake | string |
| metadata.request.cf.tlsVersion | string |
| metadata.request.headers.cf_connecting_ip | string |
| metadata.request.headers.cf_ipcountry | string |
| metadata.request.headers.cf_ray | string |
| metadata.request.headers.host | string |
| metadata.request.headers.referer | string |
| metadata.request.headers.x_client_info | string |
| metadata.request.headers.x_forwarded_proto | string |
| metadata.request.headers.x_real_ip | string |
| metadata.request.host | string |
| metadata.request.method | string |
| metadata.request.path | string |
| metadata.request.protocol | string |
| metadata.request.search | string |
| metadata.request.url | string |
| metadata.response.headers.cf_cache_status | string |
| metadata.response.headers.cf_ray | string |
| metadata.response.headers.content_location | string |
| metadata.response.headers.content_range | string |
| metadata.response.headers.content_type | string |
| metadata.response.headers.date | string |
| metadata.response.headers.sb_gateway_version | string |
| metadata.response.headers.transfer_encoding | string |
| metadata.response.headers.x_kong_proxy_latency | string |
| metadata.response.origin_time | number |
| metadata.response.status_code | number |