Metrics API with Prometheus & Grafana (self-hosted)
Self-hosting Prometheus and Grafana gives you full control over retention, alert routing, and dashboards. The Supabase Metrics API slots into any standard Prometheus scrape job, so you can run everything locally, on a VM, or inside Kubernetes.
Use this guide only if you need full manual control (custom scrape topology, self-hosted Prometheus or non-standard auth).
Otherwise, use the Grafana Cloud integration available in the Supabase Dashboard.
Architecture#
- Prometheus scrapes
https://<project-ref>.supabase.co/customer/v1/privileged/metricsevery minute using HTTP Basic Auth. - Grafana reads from Prometheus and renders dashboards/alerts.
- Prometheus Alertmanager or your preferred system sends notifications when Prometheus rules fire (optional) .
1. Deploy Prometheus#
Install Prometheus using your preferred method (Docker, Helm, binaries). Then add a Supabase-specific job to prometheus.yml:
1scrape_configs:2 - job_name: 'supabase'3 scrape_interval: 60s4 metrics_path: /customer/v1/privileged/metrics5 scheme: https6 basic_auth:7 username: username8 password: '<secret API key (sb_secret_...)>'9 static_configs:10 - targets:11 - '<project-ref>.supabase.co:443'12 labels:13 project: '<project-ref>'- Keep the scrape interval at 60 seconds to match Supabase’s refresh cadence.
- If you run Prometheus behind a proxy, make sure it can establish outbound HTTPS connections to
*.supabase.co. - Store secrets (Secret API key) with your secret manager or inject them via environment variables.
2. Deploy Grafana#
Install Grafana (Docker image, Helm chart, or packages) and connect it to Prometheus:
- In Grafana, go to Connections → Data sources → Add data source.
- Choose Prometheus, set the URL to your Prometheus endpoint (for example
http://prometheus:9090), and click Save & test.
3. Import Supabase dashboards#
- Go to Dashboards → New → Import.
- Paste the contents of
supabase-grafana/dashboard.json. - Select your Prometheus datasource when prompted.
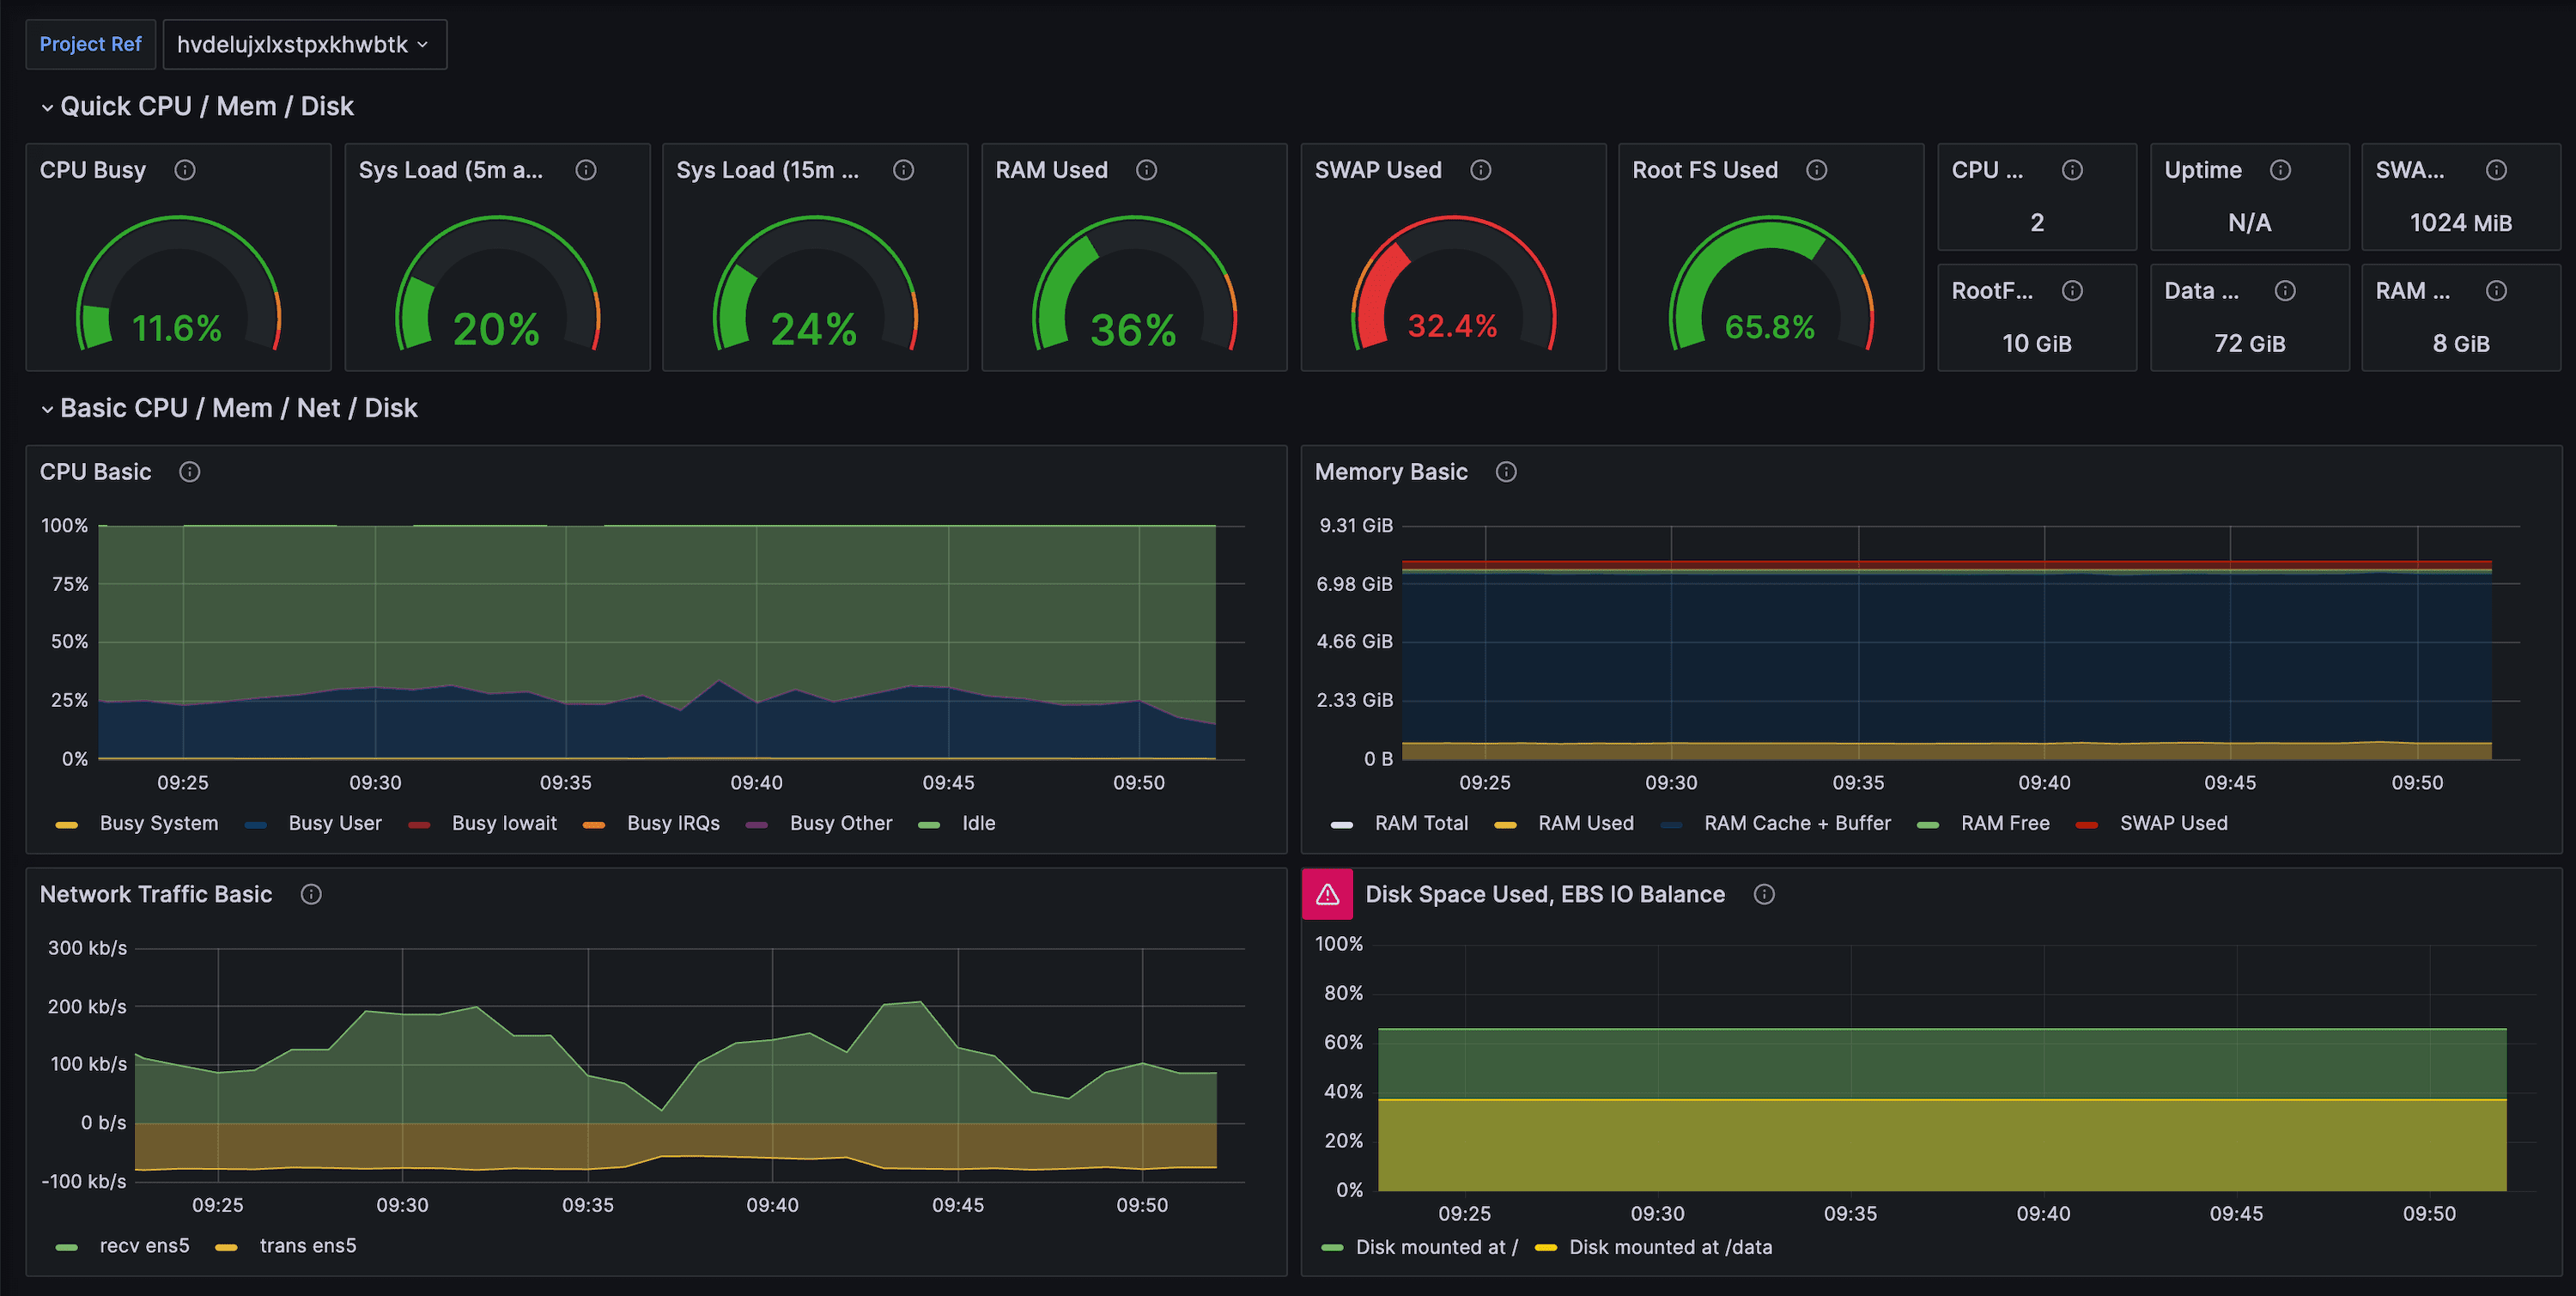
You now have over 200 production-ready panels covering CPU, IO, WAL, replication, index bloat, and query throughput.
4. Configure alerting#
- Import the sample rules from
docs/example-alerts.mdinto Prometheus or Grafana Alerting. - Tailor thresholds (for example, disk utilization, long-running transactions, connection saturation) to your project’s size.
- Route notifications via Alertmanager, Grafana OnCall, PagerDuty, or any other supported destination.
5. Operating tips#
- Multiple projects: add one scrape job per project ref so you can separate metrics and labels cleanly.
- Right-sizing guidance: pair the dashboards with Supabase’s Query Performance report and Advisors to decide when to optimize vs upgrade.
- Security: rotate Secret API keys on a regular cadence and update the Prometheus config accordingly.