Vendor-agnostic Metrics API setup
The Supabase Metrics API is intentionally vendor-agnostic. Any collector that can scrape a Prometheus text endpoint over HTTPS can ingest the data. This guide explains the moving pieces so you can adapt them to AWS Managed Prometheus, Grafana Mimir, VictoriaMetrics, Thanos, or any other system.
Components#
- Collector – Prometheus, Grafana Agent, VictoriaMetrics agent, Mimir scraper, etc.
- Long-term store (optional) – Managed Prometheus, Thanos, Mimir, VictoriaMetrics.
- Visualization/alerting – Grafana, Datadog, New Relic, custom code.
1. Define the scrape job#
No matter which collector you use, you need to hit the Metrics API once per minute with HTTP Basic Auth:
1- job_name: supabase2 scrape_interval: 60s3 metrics_path: /customer/v1/privileged/metrics4 scheme: https5 basic_auth:6 username: username7 password: '<secret API key (sb_secret_...)>'8 static_configs:9 - targets:10 - '<project-ref>.supabase.co:443'11 labels:12 project: '<project-ref>'Collector-specific notes#
- Grafana Agent / Alloy: use the
prometheus.scrapecomponent with the same parameters. - AWS Managed Prometheus (AMP): deploy the Grafana Agent or AWS Distro for OpenTelemetry (ADOT) in your VPC, then remote-write the scraped metrics into AMP.
- VictoriaMetrics / Mimir: reuse the same scrape block; configure remote-write or retention rules as needed.
2. Secure the credentials#
- Store the Secret API key in your secret manager (AWS Secrets Manager, GCP Secret Manager, Vault, etc.).
- Rotate the key periodically via Project Settings → API Keys and update your collector.
- If you need to give observability vendors access without exposing a broadly-scoped key, create a dedicated Secret API key for metrics-only automation.
3. Downstream dashboards#
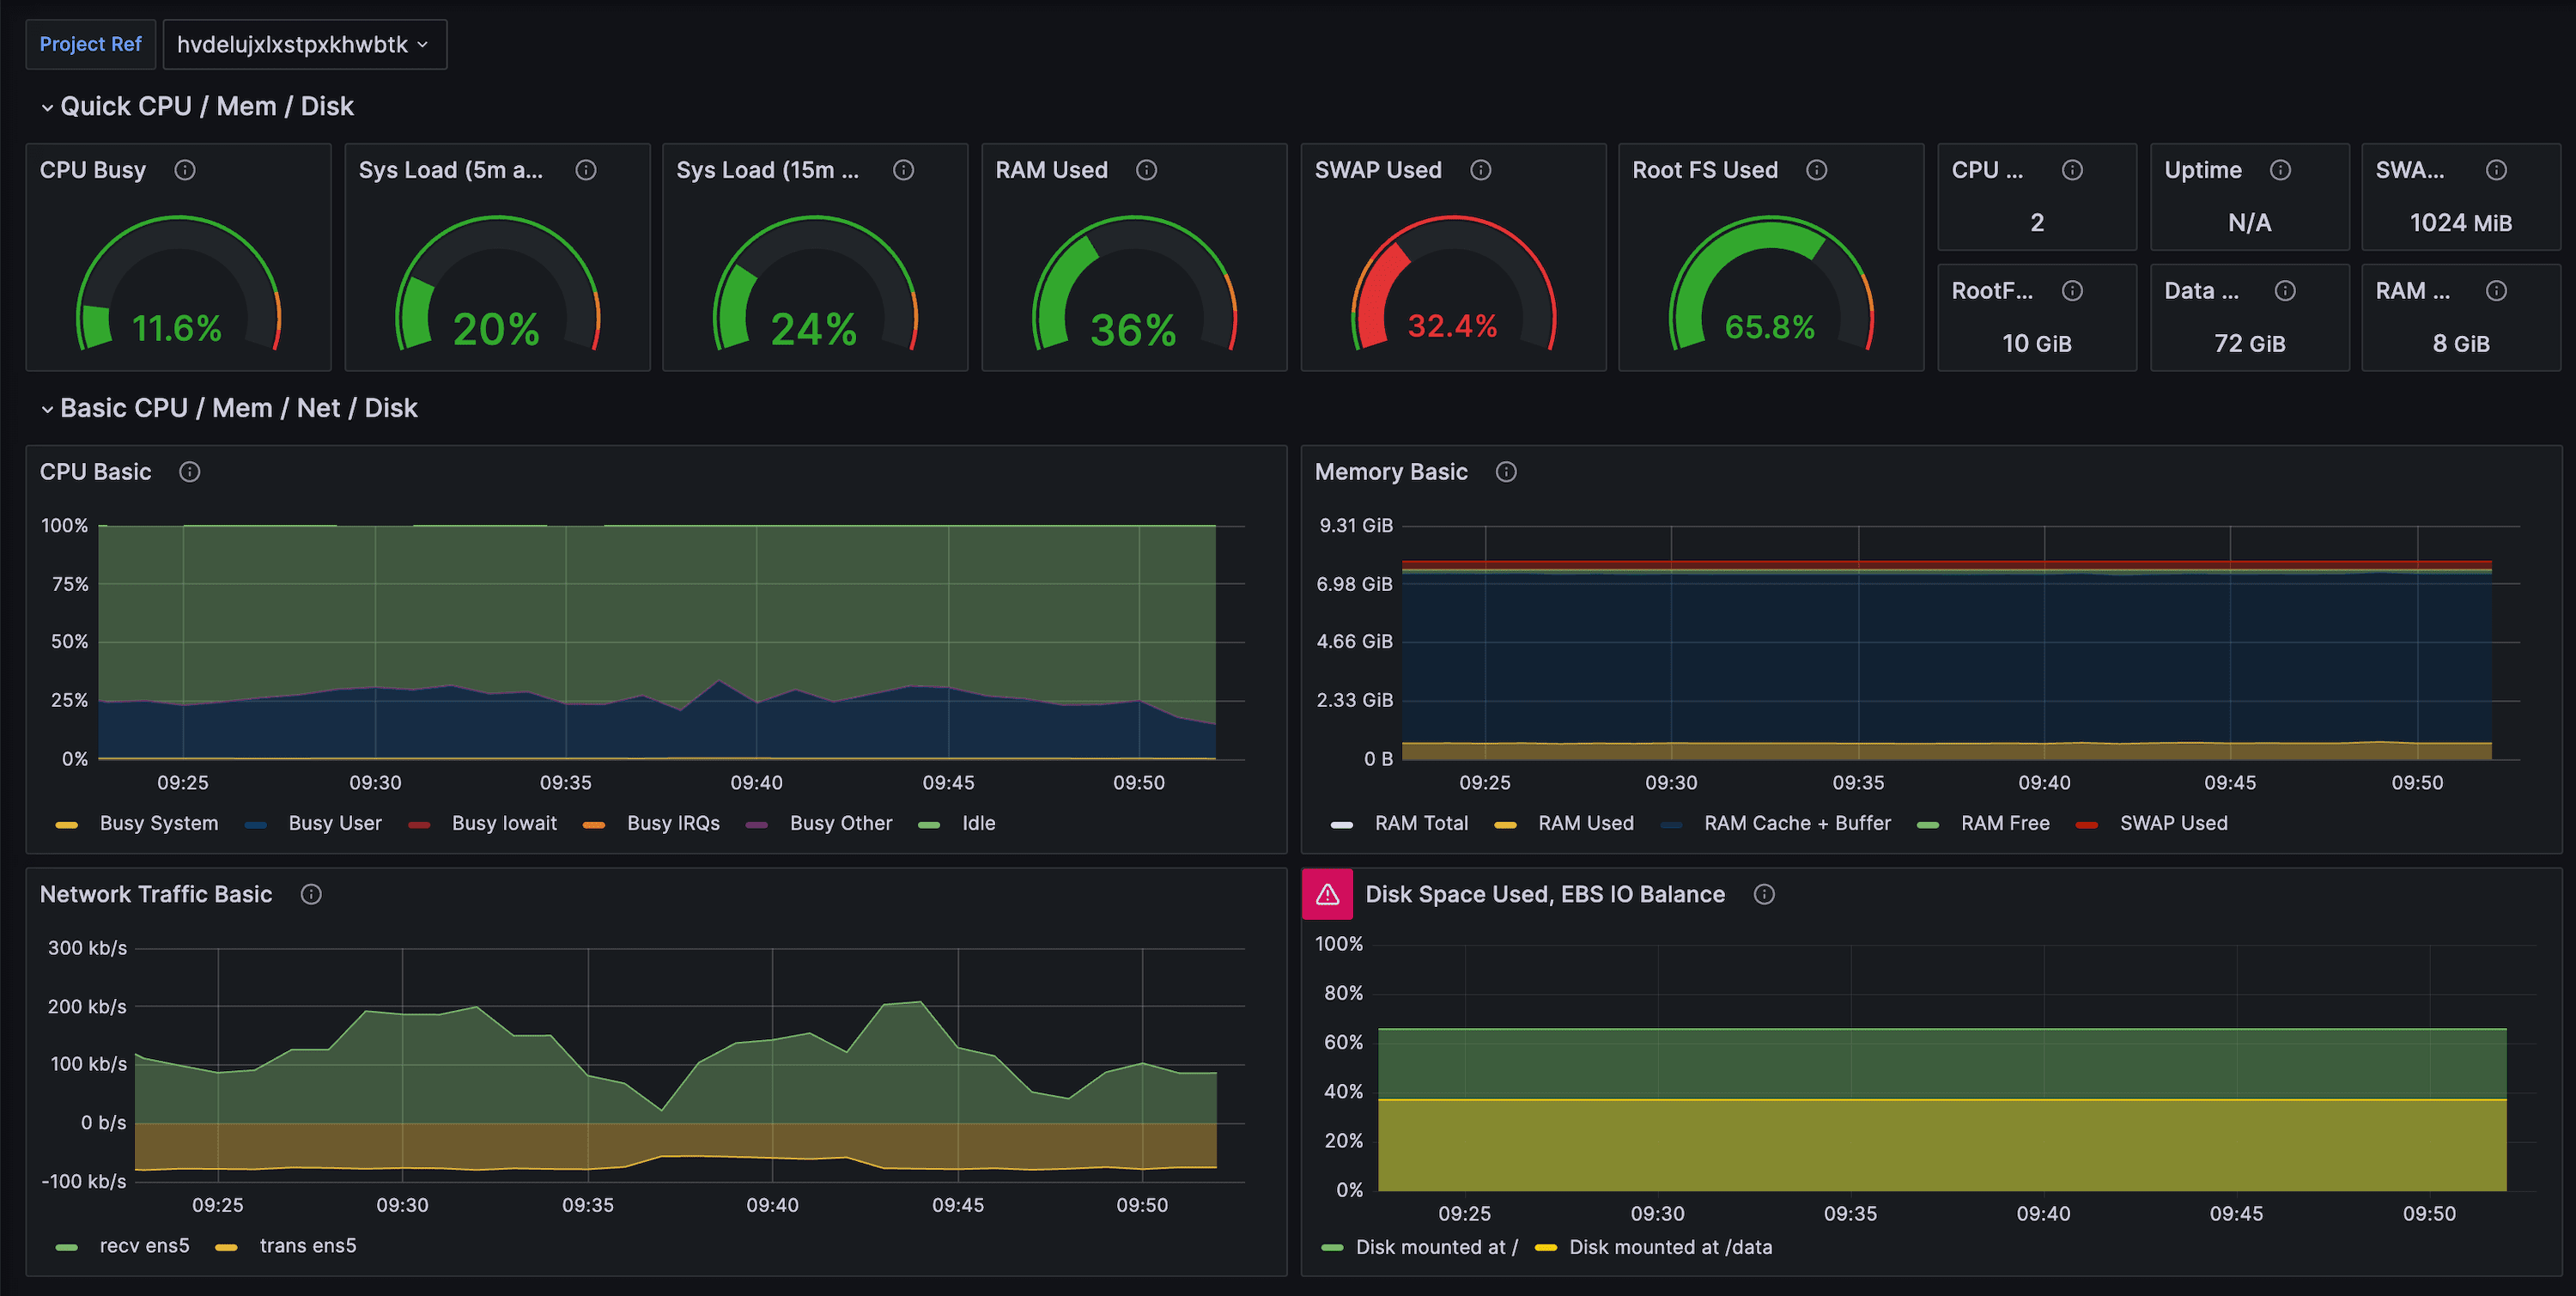
- Import the Supabase Grafana dashboard regardless of where Grafana is hosted.
- For other tools, group metrics by categories (CPU, IO, WAL, replication, connections) and recreate the visualizations that matter most to your team.
- Tag or relabel series with
project,env, orteamlabels to make multi-project views easier.
4. Alerts and automation#
- Start with the example alert rules and adapt thresholds for your workload sizes.
- Pipe alerts into PagerDuty, Slack, Opsgenie, or any other compatible target.
- Combine Metrics API data with log drains, Query Performance, and Advisors to build right-sizing playbooks.
5. Multi-project setups#
- Create one scrape job per project ref so you can control sampling individually.
- If you run many projects, consider templating the scrape jobs via Helm, Terraform, or the Grafana Agent Operator.
- Use label joins (
project,instance_class,org) to aggregate across tenants or environments.