Logs in the CLI
Use supabase logs to inspect local or hosted service events from your terminal. Export full records for scripts, or query hosted logs with SQL.
This guide requires Supabase CLI v3.
Query local logs#
The command reads your local stack by default. Local reads require the experimental stack runtime. Set SUPABASE_EXPERIMENTAL_STACK=1, or set stack = true under [experimental] in your CLI configuration.
supabase logssupabase logs sourcessupabase logs sources --output-format jsonLocal reads work while a stack is stopped. They never start a stack or service.
supabase logs --stack feature-a --since startsupabase logs --stack-id stack-id-prefix --service postgres --output-format textsupabase logs --resource instance-id --since 2d--stack selects an existing stack by name. --stack-id accepts an ID or unique prefix. --service postgres selects the local database service. Local selectors also include service names, instance IDs, and gateway when the stack exposes the shared API listener.
--resource selects a local instance ID and cannot be combined with --service. --since start reads from each selected service's latest launch. Local reads do not support --level, --search, --kind, or SQL.
Local source discovery lists existing stack instances and gateway support. A listed source does not guarantee retained events.
Query remote project logs#
Use --remote to query the linked project. Select another project with --remote=<ref>, or a branch of the linked project with --remote=<branch>. Hosted reads require authentication and access to that project. Database URLs are unsupported.
supabase logs --remotesupabase logs --remote=abcdefghijklmnopqrst --service postgressupabase logs --remote=feature-branch --service authDiscover service selectors and supported filters before narrowing your query:
supabase logs sources --remotesupabase logs sources --remote --service postgresHosted discovery describes service capabilities. A listed source does not imply that it contains events.
Hosted selectors include edge, postgres, postgrest, auth, auth-audit, storage, realtime, functions, function-edge, supavisor, pgbouncer, pg-upgrade, and experimental compute. functions selects console events; function-edge selects invocation events.
Filter logs#
supabase logs --remote --service postgres --level error --since 30msupabase logs --remote --service auth --search "invalid token"supabase logs --remote --service functions --resource function-id --limit 500supabase logs --remote --service postgres --service auth --level error --level warnRepeat --service or --level to select multiple values. --search matches a case-insensitive literal substring in hosted messages. % and _ have no wildcard meaning.
Severity comes from service fields, such as Postgres severity or HTTP status. Unknown severity stays unknown. --level requires a supported severity mapping. Without --service, a level filter selects postgres, edge, auth, functions, and function-edge. Use logs sources --remote --service <service> to check support.
Set the time range#
The default range is the last hour, with an initial history limit of 100 rows. Set --limit from 1 to 1000 to change that count.
supabase logs --remote --since 30m --limit 500supabase logs --remote --from 2026-11-01T09:00:00Z --to 2026-11-01T10:00:00Z--since accepts a duration or UTC timestamp. Use --from and --to for fixed UTC bounds ending in Z. With only --to, the range covers the hour ending at that timestamp. Do not combine --since with --from or --to.
Each hosted request can span at most 24 hours. Local ranges have no 24-hour ceiling. The displayed lower bound stays fixed during refreshes. If a later load requires a wider request window, restart with a narrower range.
Interactive vs JSON output#
An interactive terminal opens the browser when you omit --output-format. Explicit --output-format text always performs one finite read. The browser also stays closed in CI, with TERM=dumb, or when stdin or stdout is not a terminal.
Use --output-format json for an indented array, or --output-format stream-json for newline-delimited JSON. Both formats perform one read and exit.
supabase logs --remote --service postgressupabase logs --remote --service postgres --output-format jsonsupabase logs --remote --service postgres --output-format stream-json| Format | Result |
|---|---|
text | Plain text. Piped filtered output keeps one event per line, escapes embedded newlines and carriage returns, and avoids hard wrapping. |
json | An indented array of full records. |
stream-json | Newline-delimited JSON events. Filtered reads emit log-entry or log-marker events with the record in data. SQL reads emit a result event containing the result array. |
Use the interactive browser#
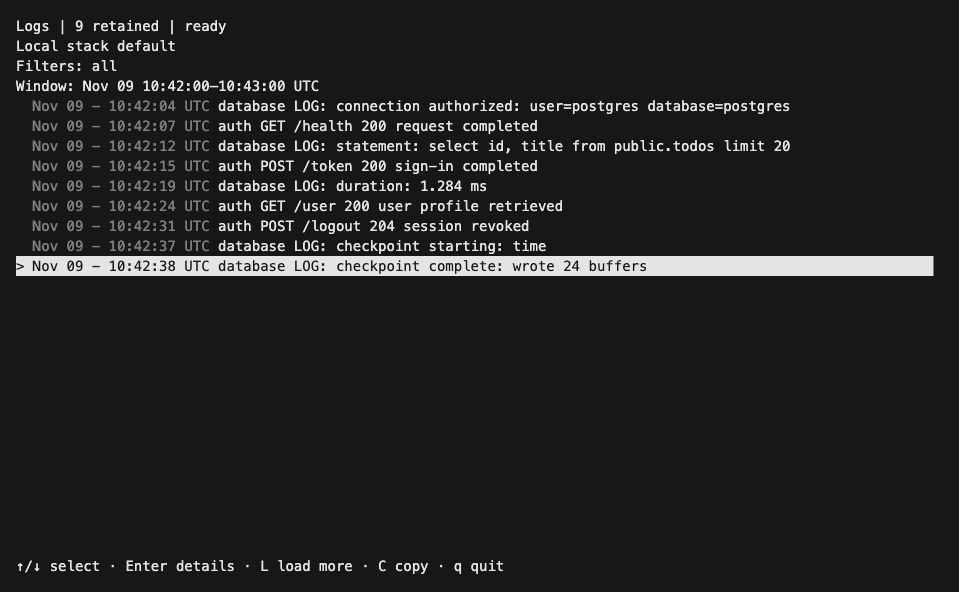
Example local logs in the interactive explorer.
| Key | Action |
|---|---|
| Up or down arrow | Select a row. |
| Enter | Open the selected record's details. |
| Escape | Return to the list, or close an error panel. |
C | Copy the full selected record as indented JSON. |
L | Load newer filtered logs, or rerun custom SQL. |
q | Exit. |
| Ctrl+C | Cancel and exit with status 130. |
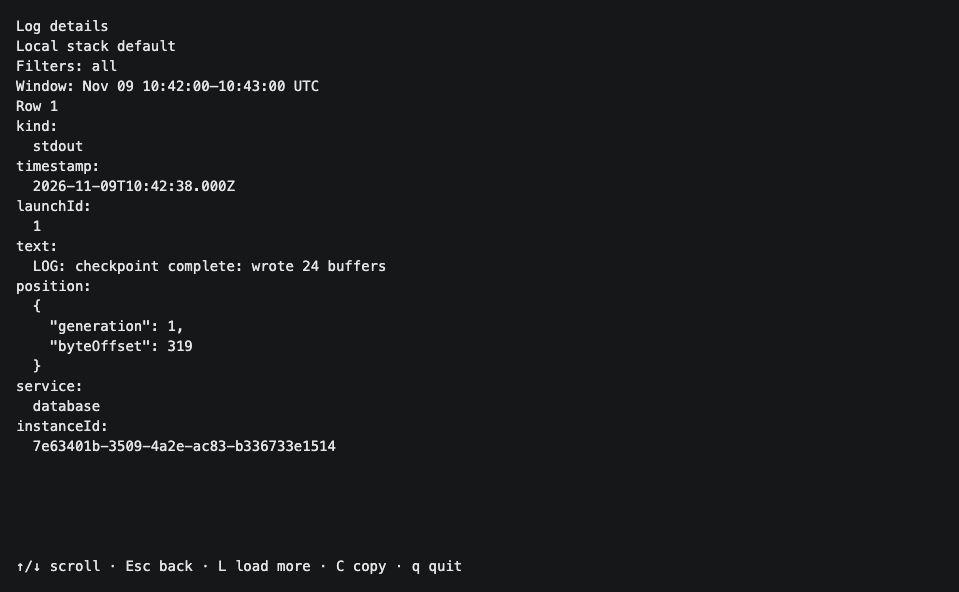
Press Enter to inspect the selected record.
The header shows the hosted project name and ref, or the local stack, plus active filters. If name lookup fails, it shows the project ref. Window shows the requested UTC range, even when results contain no timestamps.
Empty results keep the browser open. L loads on demand and reports the number of new logs, including zero. The browser does not poll or follow in the background. Filtered loads append newer results and preserve selection and viewport. The browser retains up to 1000 filtered rows and approximately 8 MiB. A notice appears when older rows are discarded. An open detail view stays pinned to its record.
Hosted filtered loads read up to five pages of 1000 rows per load. More pending means L continues toward the same captured end time. After that range completes, the next load advances the end. The footer reports page progress. Refreshes use an overlap to catch recent arrivals; they cannot guarantee capture of events that arrive after that overlap.
A rate-limited page retries once after at least 60 seconds, or longer if Retry-After requires it. The footer shows the wait and UTC retry time. You can quit during the wait. Other load failures open a scrollable error panel. Use arrows to scroll, Escape to return, or L to retry. Existing rows and selection remain available.
Copying reports success or failure in the footer. On Linux, install wl-clipboard, xclip, or xsel if no clipboard tool is available. C is inactive in the error panel.
Export results#
Pipes and machine-readable output perform one read and exit. The unified command has no --follow flag, tail subcommand, or query subcommand.
supabase logs --remote --service postgres --level error --output-format textsupabase logs --remote --service postgres --output-format json > postgres.jsonsupabase logs --remote --service postgres --output-format stream-json > postgres.ndjsonHosted records retain IDs, severity, timestamps, and attributes. service uses the selector name, such as postgres; source keeps the original value, such as postgres_logs. Local records retain instance IDs, launch IDs, positions, and loss markers. Progress and retry messages go to stderr.
Use --output-format for both logs and logs sources. These commands reject the legacy -o and --output flags.
Query with SQL#
For ClickHouse SQL syntax, available columns, and query examples, see Query logs with SQL.
Pass SQL with --sql, --file <path>, or --file - for piped input. SQL requires an explicit hosted target:
supabase logs --remote --sql "select timestamp, id, event_message, log_attributes from logs order by timestamp desc limit 20"Save this query as postgres.sql:
select timestamp, id, event_message, log_attributesfrom logswhere source = 'postgres_logs'order by timestamp desclimit 20;supabase logs --remote --file postgres.sql --since 30m --output-format jsoncat postgres.sql | supabase logs --remote --file - --output-format stream-jsonThe CLI reads stdin only with --file -. This flag requires piped, nonempty input. --file has no -f alias. Choose either --sql or --file. SQL cannot be combined with --service, --resource, --kind, --level, --search, --stack, or --stack-id. Time-range flags still apply. SQL controls its own limit; the CLI's --limit applies to filtered history.
In the browser, SQL rows stay in result order. L reruns the query from the original lower bound through the current time. A successful query replaces the previous results and reports Query reloaded. SQL keeps the full returned result without the filtered browser's 1000-row or memory cap. Missing row timestamps appear as a dash; record details retain the full raw result.
Queries use a Management API GET endpoint. Server query limits, project retention, and access controls apply. A long SQL file can exceed the server URL limit. The CLI reports that HTTP error without splitting or rewriting the query.
Command options#
Run supabase logs --help or supabase logs sources --help for the help included with your installed version.
Option for supabase logs | Behavior |
|---|---|
--remote[=<ref|branch>] | Read the linked project, a project ref, or a branch of the linked project. Default: local. |
--stack <name> | Select an existing local stack by name. |
--stack-id <id> | Select an existing local stack by ID or unique prefix. |
--service <selector> | Filter by service. Repeat for multiple services. |
--resource <id-or-name> | Select a hosted function ID, Compute name, or local instance ID. |
--kind <kind> | Select a Compute stream: app, requests, or builds. Requires --service compute. |
--level <level> | Filter severity: error, warn, warning, info, debug, log, or notice. Repeat for multiple levels. |
--search <text> | Match a case-insensitive hosted message substring. |
--since <duration-or-timestamp> | Set the lower time bound. Default: 1h. Local stacks also accept start. |
--from <timestamp> | Set the lower UTC bound with a timestamp ending in Z. |
--to <timestamp> | Set the initial upper UTC bound with a timestamp ending in Z. L can advance it. |
--limit <count> | Set initial filtered history count from 1 to 1000. Default: 100. |
--sql <query> | Query hosted logs with ClickHouse SQL. Requires --remote. |
--file <path> | Read SQL from a file. Use - for stdin. Requires --remote. |
Compute sources require SUPABASE_EXPERIMENTAL_COMPUTE=true. Compute app output has no reliable severity mapping; --level requires --kind requests or --kind builds.
supabase logs sources accepts --remote, --stack, --stack-id, and --service. Its --service describes one service rather than filtering log rows.
Both commands accept shared flags, including --output-format text|json|stream-json, --profile <name>, and --workdir <path>. --workdir identifies the directory containing your supabase/ folder. An explicit path is used as given, without searching parent directories.
Migrate existing log commands#
In v3, supabase compute logs and supabase stack logs are deprecated and warn on stderr. They retain their existing flags, defaults, and follow behavior until removal in v4.
| Existing command | Unified command |
|---|---|
supabase compute logs api | supabase logs --remote --service compute --resource api |
supabase stack logs --stack feature-a | supabase logs --stack feature-a |
The unified browser uses L for manual loads. Scripts perform a finite read. Remove --follow or -f when moving to supabase logs. On the deprecated commands, -f still means --follow; SQL files use the full --file flag on the unified command.
Troubleshoot#
| Symptom | Next step |
|---|---|
| No events | Check the target, time range, service, and filters. Discovery lists support, not event volume. Check logging configuration and source capture limits. |
| Local stack unavailable | Turn on the experimental stack runtime and select an existing stack. Log reads never create or start one. |
| Unsupported level, resource, or kind | Inspect logs sources --remote --service <service>. Local reads do not support level, search, kind, or SQL filters. |
| Invalid time range | End --from and --to timestamps in Z, separate --since from explicit bounds, and keep hosted ranges within 24 hours. |
| SQL error | Check ClickHouse syntax and columns on logs. Remove filter-selector flags and select --remote. Shorten oversized queries if the server rejects the URL. |
| Access denied | Check authentication, profile, project access, and scoped token permissions. Hosted log reads require analytics_logs_read; project or branch resolution can also require read permissions. |
| Clipboard failure | Check the footer error and install a supported clipboard tool on Linux. Export JSON if clipboard access is unavailable. |