Debugging Edge Functions
Debugging tips and Edge Function limitations.
Logs & debugging
Logs are provided for each function invocation, locally and in production.
How to access logs
Hosted
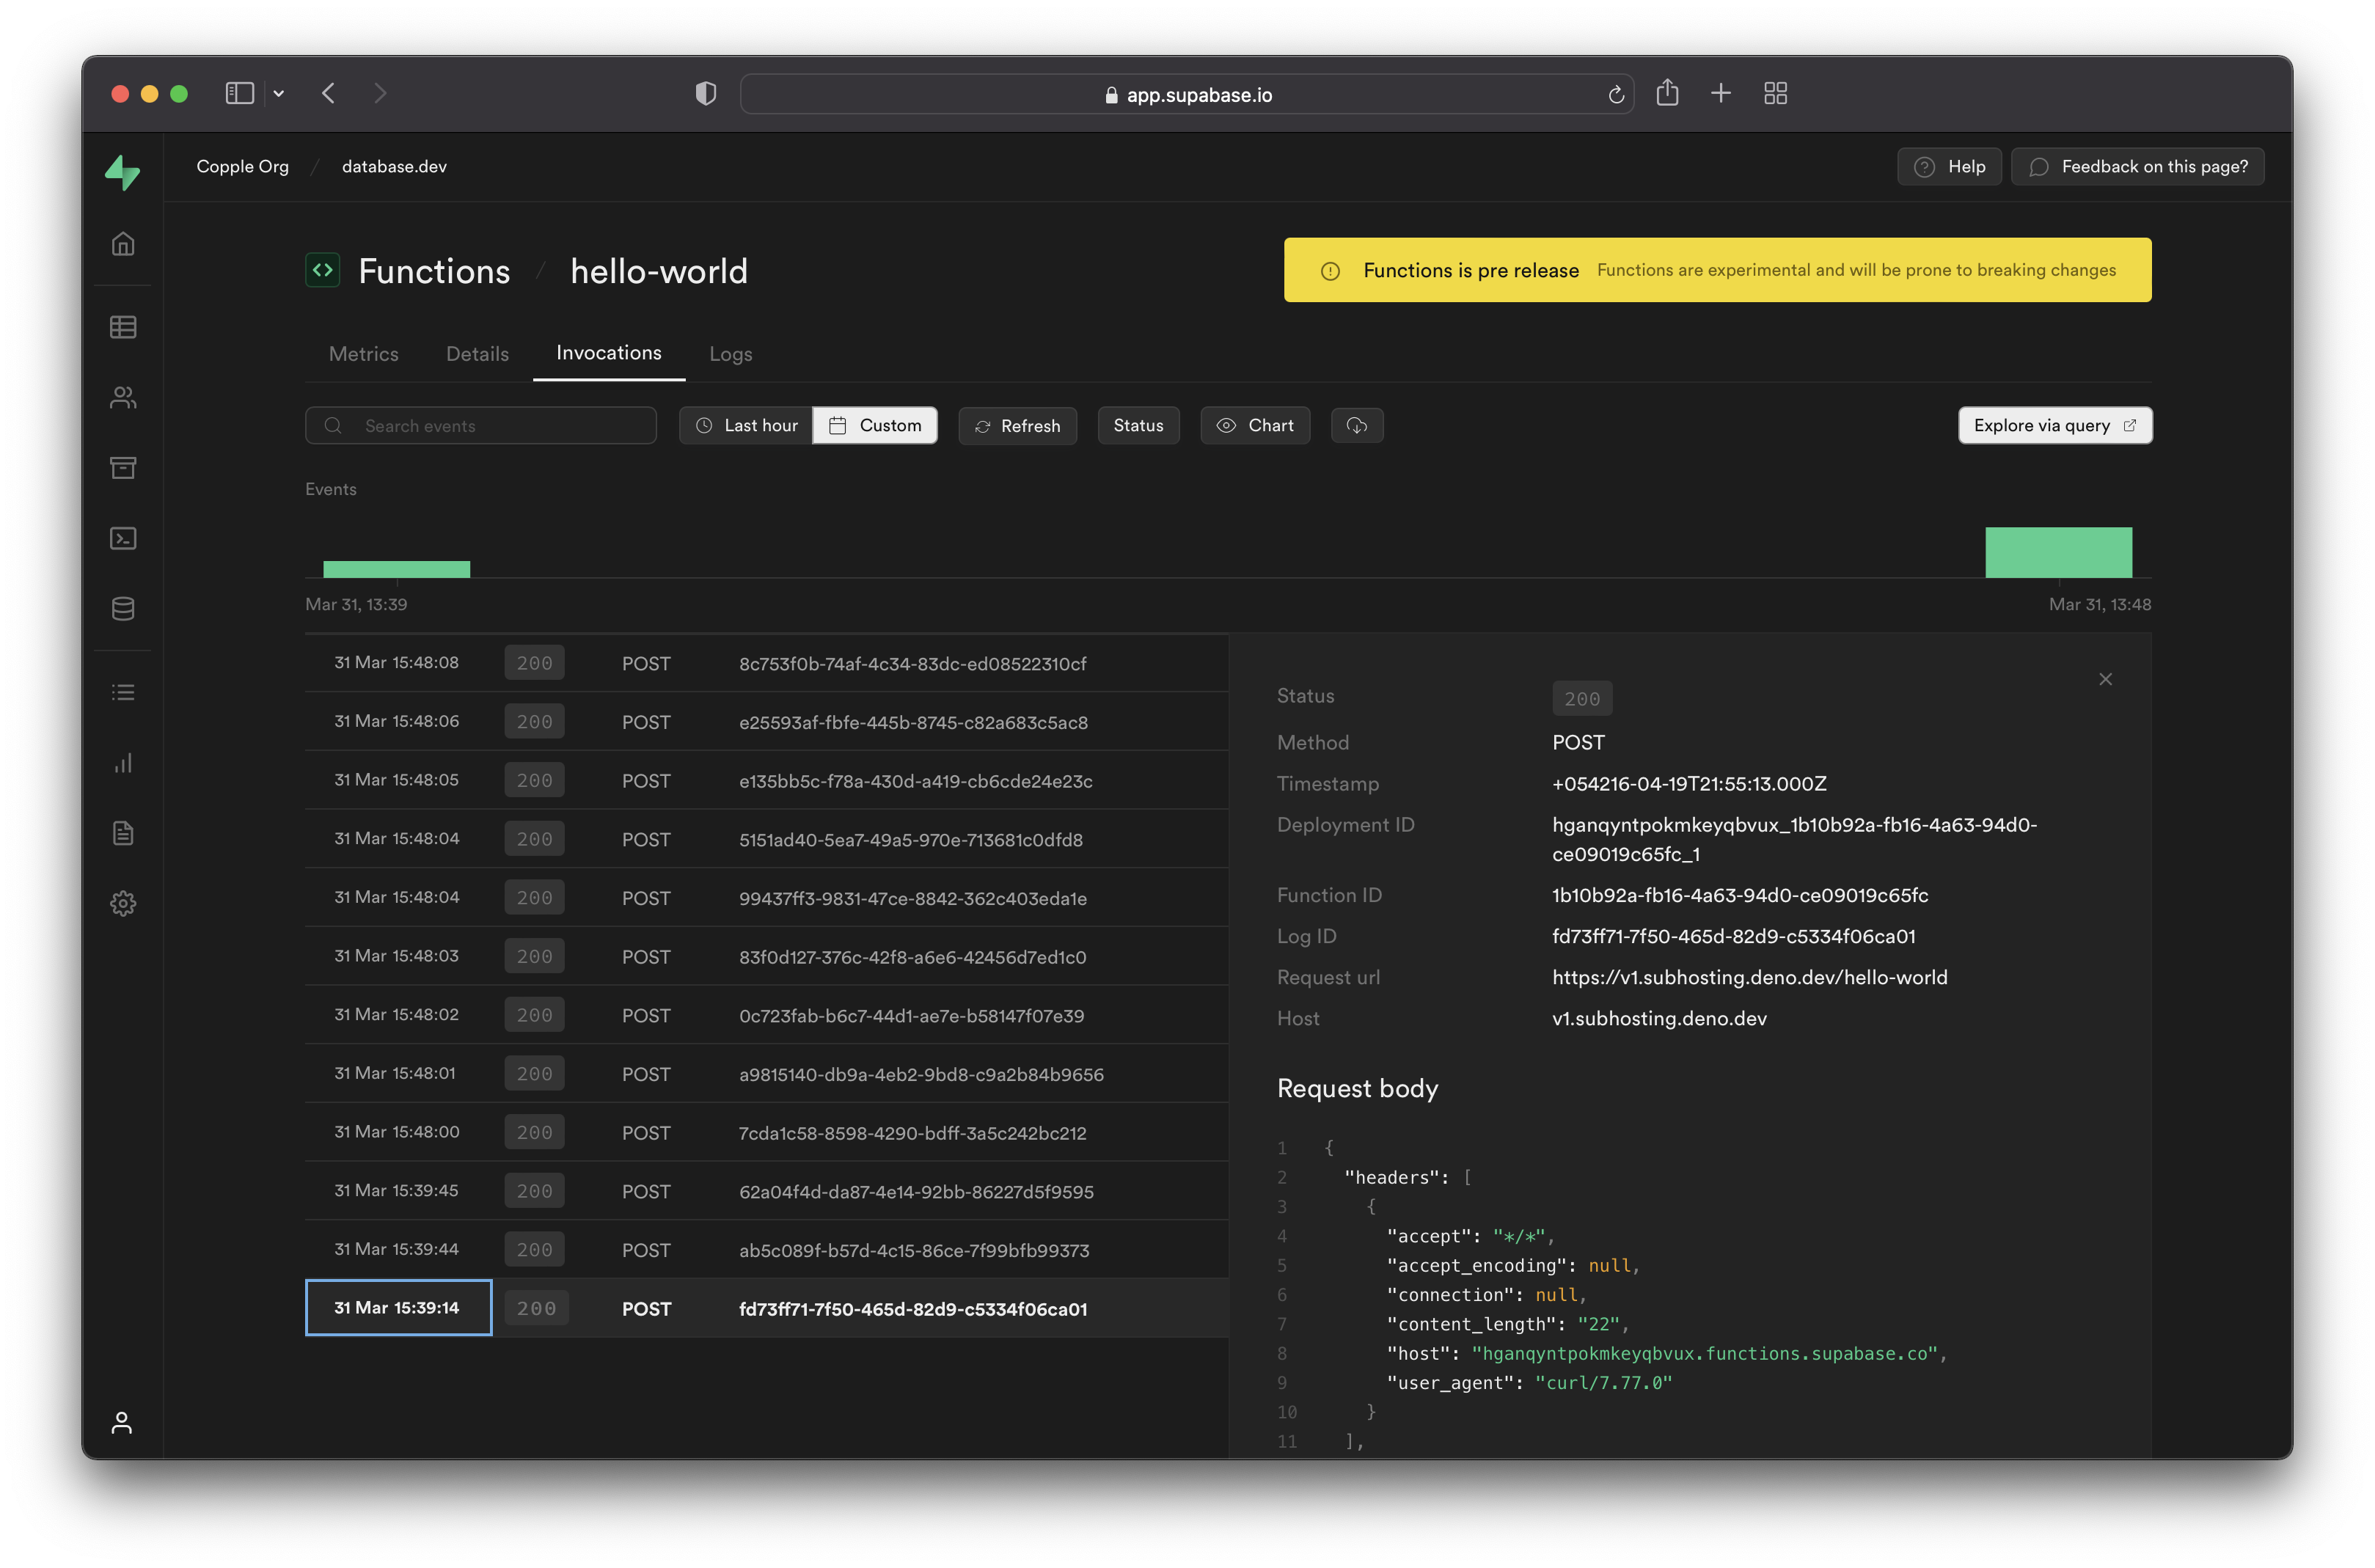
You can access both tools from the Functions section of the Dashboard. Select your function from the list, and click Invocations or Logs:
- Invocations: shows the Request and Response for each execution. You can see the headers, body, status code, and duration of each invocation. You can also filter the invocations by date, time, or status code.
- Logs: shows any platform events, uncaught exceptions, and custom log events. You can see the timestamp, level, and message of each log event. You can also filter the log events by date, time, or level.
Local
When developing locally you will see error messages and console log statements printed to your local terminal window.
Events that get logged
- Uncaught exceptions: Uncaught exceptions thrown by a function during execution are automatically logged. You can see the error message and stack trace in the Logs tool.
- Custom log events: You can use
console.log,console.error, andconsole.warnin your code to emit custom log events. These events also appear in the Logs tool. - Boot and Shutdown Logs: The Logs tool extends its coverage to include logs for the boot and shutdown of functions.
A custom log message can contain up to 10,000 characters. A function can log up to 100 events within a 10 second period.
Here is an example of how to use custom logs events in your function:
_23Deno.serve(async (req) => {_23 try {_23 const { name } = await req.json()_23_23 if (!name) {_23 console.warn('Empty name provided')_23 }_23_23 const data = {_23 message: `Hello ${name || 'Guest'}!`, // Provide a default value if name is empty_23 }_23_23 console.log(`Name: ${name}`)_23_23 return new Response(JSON.stringify(data), { headers: { 'Content-Type': 'application/json' } })_23 } catch (error) {_23 console.error(`Error processing request: ${error.message}`)_23 return new Response(JSON.stringify({ error: 'Internal Server Error' }), {_23 status: 500,_23 headers: { 'Content-Type': 'application/json' },_23 })_23 }_23})
Troubleshooting
If you encounter any problems or issues with your Edge Functions, here are some tips and steps to help you resolve them.
Unable to deploy Edge Function
- Make sure you're on the latest version of the Supabase CLI.
- If the output from the commands above does not help you to resolve the issue, open a support ticket via the Supabase Dashboard (by clicking the "Help" button at the top right) and include all output from the commands mentioned above.
Unable to call Edge Function
If you’re unable to call your Edge Function or are experiencing any CORS issues:
- Make sure you followed the CORS guide. This guide explains how to enable and configure CORS for your Edge Functions, and how to avoid common pitfalls and errors.
- Check your function logs. Navigate to the Functions section in your dashboard, select your function from the list, and click
Logs. Check for any errors or warnings that may indicate the cause of the problem.
There are two debugging tools available: Invocations and Logs. Invocations shows the Request and Response for each execution, while Logs shows any platform events, including deployments and errors.
Edge Function takes too long to respond
If your Edge Function takes too long to respond or times out:
- Navigate to the Functions section in your dashboard, select your function from the list, and click
Logs. - In the logs, look for the
bootedevent and check if they have consistent boot times.- If the boot times are similar, it’s likely an issue with your function’s code, such as a large dependency, a slow API call, or a complex computation. You can try to optimize your code, reduce the size of your dependencies, or use caching techniques to improve the performance of your function.
- If only some of the
bootedevents are slow, find the affectedregionin the metadata and submit a support request via the "Help" button at the top.
Receiving 546 Error Response
The 546 error response might occur because:
- Memory or CPU Limits: The function might have exhausted its memory or encountered CPU limits enforced during execution.
- Event Loop Completion: If you observe "Event loop completed" in your error logs, it's likely your function is not implemented correctly. You should check your function code for any syntax errors, infinite loops, or unresolved promises that might cause this error. Or you can try running the function locally (using Supabase CLI
functions serve) to see if you can debug the error. The local console should give a full stack trace on the error with line numbers of the source code. You can also refer to Edge Functions examples for guidance.
Issues serving Edge Functions locally with the Supabase CLI
- Make sure you're on the latest version of the Supabase CLI.
- Run the serve command with the
-debugflag. - Support engineers can then try to run the provided sample code locally and see if they can reproduce the issue.
- Search the Edge Runtime and CLI repos for the error message, to see if it has been reported before.
- If the output from the commands above does not help you to resolve the issue, please open a support ticket via the Supabase Dashboard (by clicking the "Help" button at the top right) and include all output and details about your commands.
Advanced techniques
Monitoring Edge Function Resource Usage
To determine how much memory and CPU your Edge Function consumes, follow these steps:
- Navigate to the Supabase Dashboard.
- Go to Edge Functions.
- Select the specific function by clicking on its name.
- View the resource usage Metrics on the charts provided.
Edge Functions have limited resources (CPU, memory, and execution time) compared to traditional servers. Make sure your functions are optimized for performance and don't exceed the allocated resources.
Understanding CPU soft and hard Limits
An isolate is like a worker that can handle multiple requests for a function. It works until a time limit of 400 seconds is reached. Now, there are two types of limits for the CPU.
- Soft Limit: When the isolate hits the soft limit, it retires. This means it won't take on any new requests, but it will finish processing the ones it's already working on. It keeps going until it either hits the hard limit for CPU time or reaches the 400-second time limit, whichever comes first.
- Hard Limit: If there are new requests after the soft limit is reached, a new isolate is created to handle them. The original isolate continues until it hits the hard limit or the time limit. This ensures that existing requests are completed, and new ones will be managed by a newly created isolate.
Checking function boot time
Check the logs for the function. In the logs, look for a "Booted" event and note the reported boot time. If available, click on the event to access more details, including the regions from where the function was served. Investigate if the boot time is excessively high (longer than 1 second) and note any patterns or regions where it occurs. You can refer to this guide for troubleshooting regional invocations.
Finding bundle size
To find the bundle size of a function, run the following command locally:
deno info /path/to/function/index.ts
Look for the "size" field in the output which represents the approximate bundle size of the function. You can find the accurate bundle size when you deploy your function via Supabase CLI. If the function is part of a larger application, consider examining the bundle size of the specific function independently.
The source code of a function is subject to size limits:
- Free Plan: Maximum size of 2MB.
- Pro Plan: Maximum size of 10MB.
Analyze dependencies
When analyzing dependencies for your Supabase Edge Functions, it's essential to review both Deno and NPM dependencies to ensure optimal performance and resource utilization. By selectively importing only the required submodules, you can effectively reduce the size of your function's dependencies and optimize its performance. Before finalizing your imports, ensure to review both Deno and NPM dependencies, checking for any unnecessary or redundant dependencies that can be removed. Additionally, check for outdated dependencies and update to the latest versions if possible.
Deno Dependencies
Run deno info, providing the path to your input map if you use one.
Review the dependencies listed in the output. Pay attention to any significantly large dependencies, as they can contribute to increased bundle size and potential boot time issues.
Examine if there are any unnecessary or redundant dependencies that can be removed. Check for outdated dependencies and update to the latest versions if possible.
_10deno info --import-map=/path/to/import_map.json /path/to/function/index.ts
NPM Dependencies
Additionally, if you utilize NPM modules in your Edge Functions, it's crucial to be mindful of their size and impact on the overall bundle size. While importing NPM modules, consider using the notation import { submodule } from 'npm:package/submodule' to selectively import specific submodules rather than importing the entire package. This approach can help minimize unnecessary overhead and streamline the execution of your function.
For example, if you only need the Sheets submodule from the googleapis package, you can import it like this:
_10import { Sheets } from 'npm:@googleapis/sheets'
Limitations
- Outgoing connections to ports
25and587are not allowed. - Serving of HTML content is not supported (
GETrequests that returntext/htmlwill be rewritten totext/plain). - Deno and Node file system APIs are not available.
- Memory limit for the function: 256MB
- Wall clock limit: 400 s
- CPU Time: 2 s