Realtime Reports
Realtime reports give insights into how your application uses Supabase Realtime, including connections, broadcast and change events, execution times, and lag.
These reports help you:
- Monitor connection counts and message volumes against your plan's quotas
- Identify performance bottlenecks in RLS policies or database replication
- Troubleshoot errors and connection issues
- Plan capacity upgrades based on usage trends
Access Realtime reports from Project Settings > Product Reports > Realtime in your project dashboard.
Realtime reports overview#
| Report | Available Plans | Description | Key Insights |
|---|---|---|---|
| Connected Clients | All | Number of connected clients | Total number of connected clients |
| Broadcast Events | All | Number of broadcast events | Broadcast events sent by clients |
| Presence Events | All | Number of presence events | Presence events sent by clients |
| Postgres Changes Events | All | Number of Postgres changes events | Postgres changes events received by clients |
| Rate of Channel Joins | All | Rate of channel joins | Rate of change of users joining channels |
| Message Payload Size | All | Median size of message payloads sent | Understand the payload sizes sent and received by clients |
| Broadcast from Database Replication Lag | Pro, Team, Enterprise | Median time between database commit and broadcast when using broadcast from database | Time taken from database change received and when it was broadcast to clients |
| (Read) Private Channel Subscription RLS Execution Time | Pro, Team, Enterprise | Execution median time of RLS (Row Level Security) to subscribe to a private channel | RLS policy impact on time to validate if user can join private channel |
| (Write) Private Channel Subscription RLS Execution Time | Pro, Team, Enterprise | Execution median time of RLS (Row Level Security) to publish to a private channel | RLS policy impact on time to validate if user can write to private channel |
| Total Requests | All | Total requests | Total requests made to the Realtime API |
| Response Errors | All | Response errors | Response errors from the Realtime API |
| Response Speed | All | Response speed | Average response time from the Realtime API |
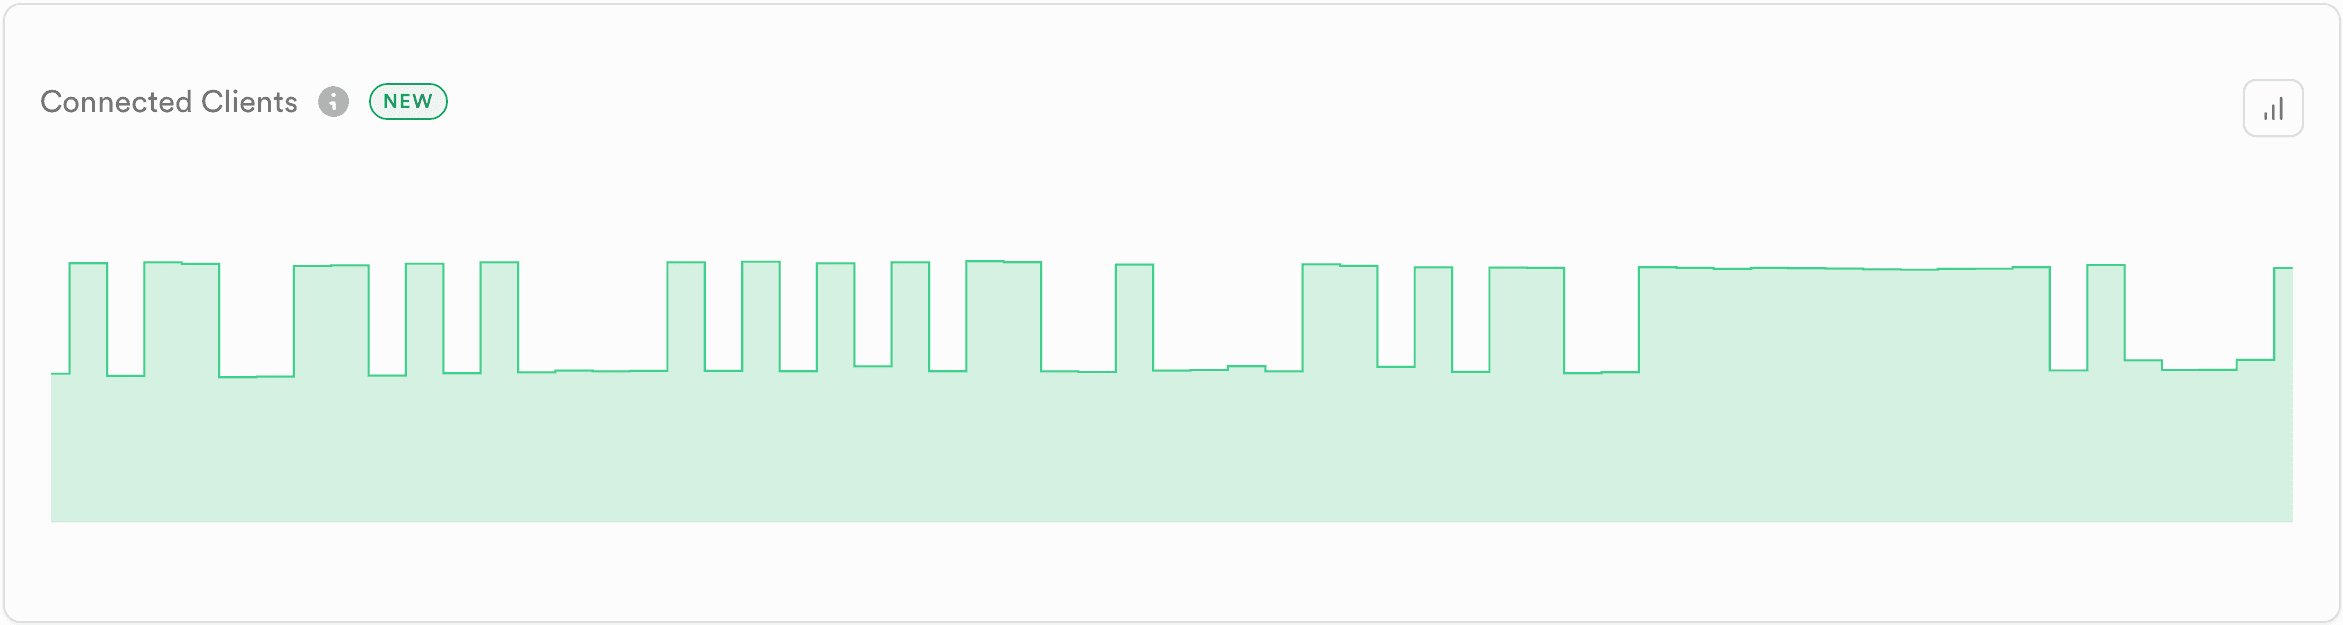
Connected Clients#
The Connected Clients report helps you monitor the total number of concurrent Realtime client connections to your project over time. This metric is essential for understanding your application's connection usage patterns and identifying when you're approaching your plan's connection limits.
The report displays the total number of connected Realtime clients, showing how connection counts fluctuate throughout the selected time period. Each client connection represents an active WebSocket connection to your Realtime service, which can subscribe to multiple channels for receiving real-time updates.
Actions you can take#
| Action | Description | More information |
|---|---|---|
| Configure connection limit | Adjust the "Max concurrent connections" setting to increase or decrease the connection limit for your project | Realtime Settings Guide |
| Upgrade plan | Increase available client connections. Connection limits vary by plan: Free (200), Pro (500), Pro no spend cap (10,000), Team (10,000), Enterprise (10,000+) | Pricing and Plans |
| Review quotas | Understand connection limits and other Realtime quotas for your plan | Realtime Quotas Reference |
| Understand connection quota | Learn how the concurrent connections quota works and how to configure it for your plan | Concurrent Peak Connections Quota Troubleshooting |
| Fix silent disconnections | Fix connection issues in background applications using heartbeat callbacks and Web Workers | Handling Silent Disconnections in Background Apps |
| Check logs | Investigate connection errors and quota errors in your project dashboard | Realtime Logs Dashboard |
| Contact support | Request custom quota increases for Enterprise plans or discuss connection requirements | Support Portal |
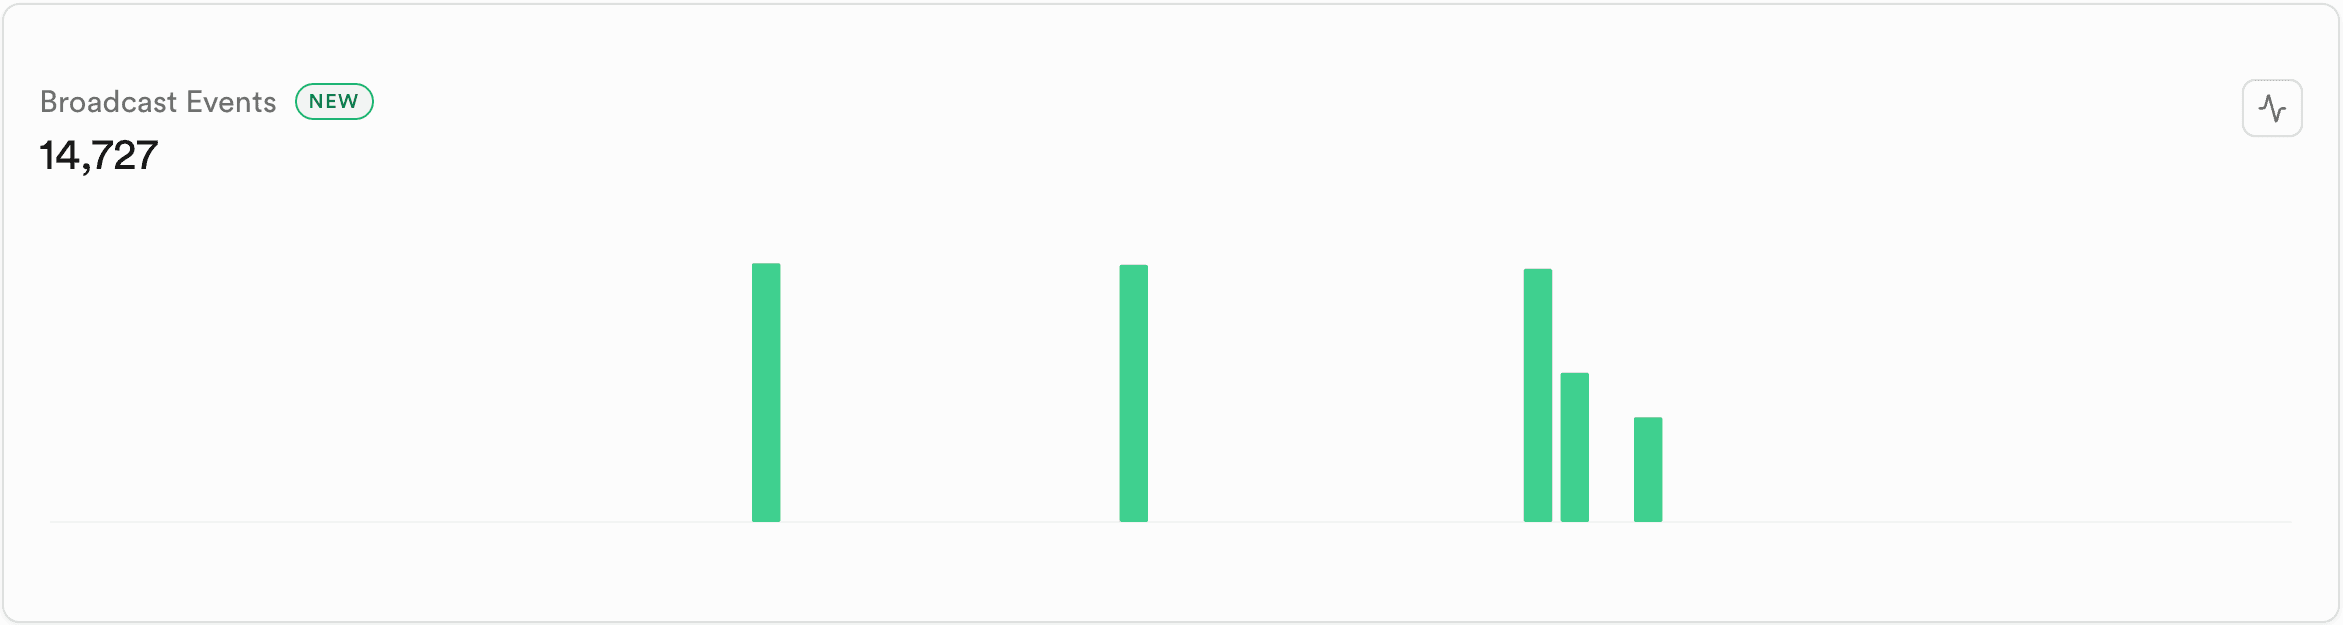
Broadcast Events#
The Broadcast Events report helps you monitor the volume of broadcast messages sent through your Realtime channels over time. This metric is essential for understanding your application's real-time messaging patterns and identifying when you're approaching your plan's message throughput limits.
The report displays the total number of broadcast events sent by clients, showing message volume throughout the selected time period. Broadcast events are low-latency messages sent between users using Realtime's pub/sub pattern, which can be sent from client libraries, REST APIs, or directly from your database. Each event represents a message broadcast to subscribers of a specific channel topic.
Actions you can take#
| Action | Description | More information |
|---|---|---|
| Configure event limits | Adjust "Max events per second" and "Max payload size in KB" settings to optimize broadcast throughput and message size limits | Realtime Settings Guide |
| Review quotas | Understand message per second limits (Free: 100, Pro: 500, Pro no spend cap/Team/Enterprise: 2,500) and broadcast payload size limits (Free: 256 KB, Pro+: 3,000 KB) | Realtime Quotas Reference |
| Check logs | Investigate broadcast errors or quota limit issues in your project dashboard | Realtime Logs Dashboard |
| Debug with logger | Enable logging to track messages sent and received, and diagnose broadcast delivery issues | Debugging Realtime with Logger |
| Learn broadcast basics | Understand how to implement and optimize broadcast messaging in your application | Broadcast Guide |
| Contact support | Request custom quota increases for Enterprise plans or discuss messaging requirements | Support Portal |
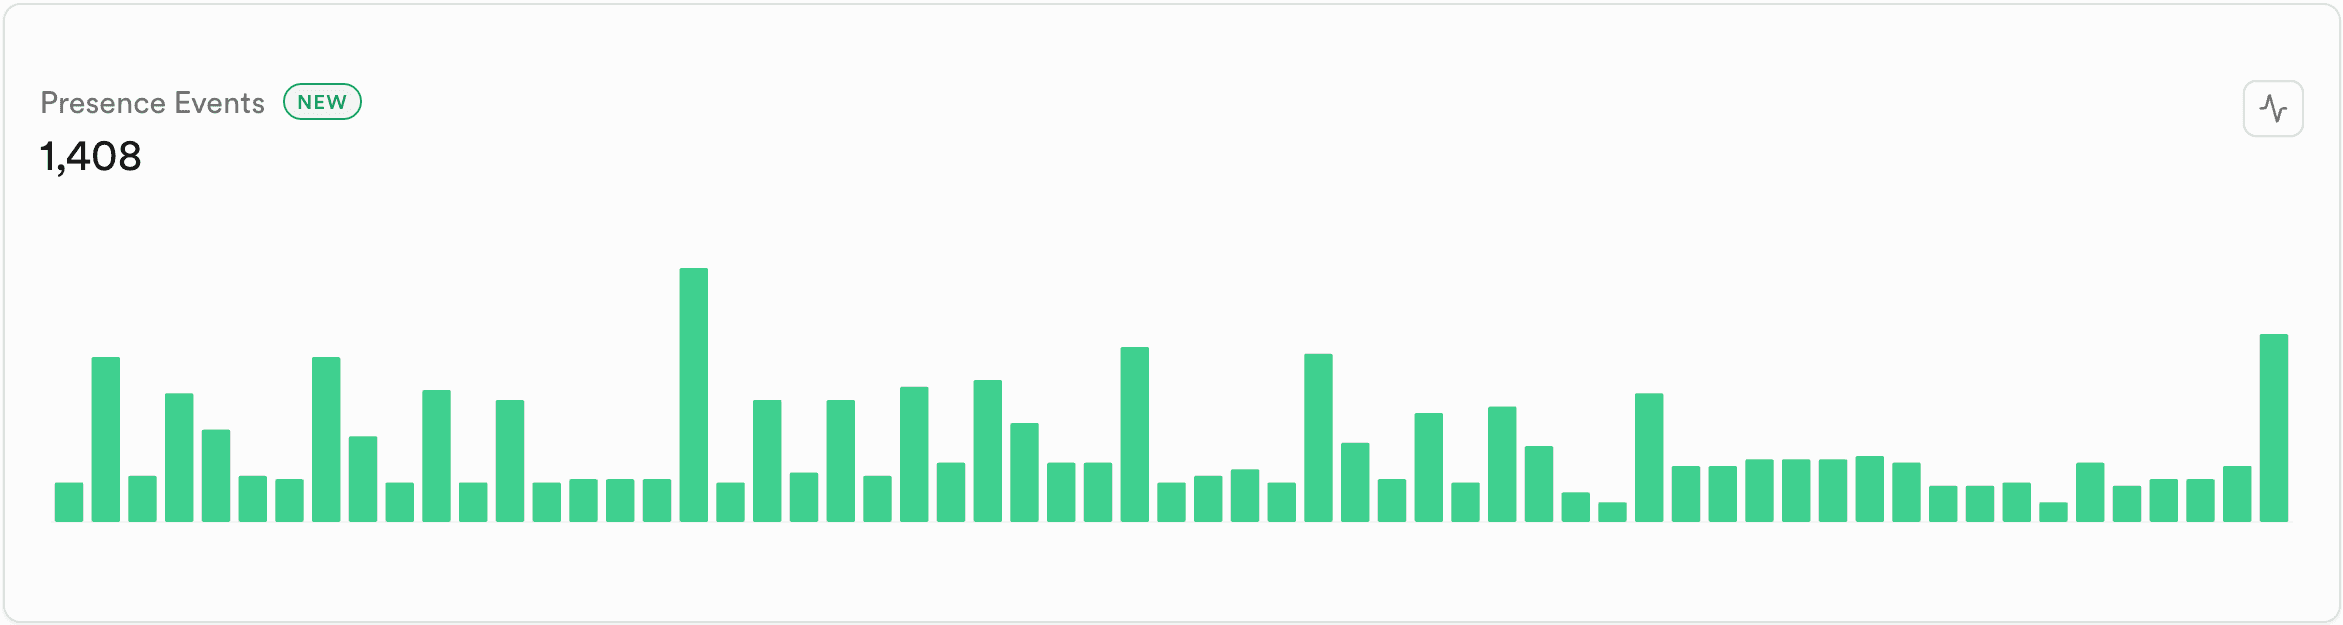
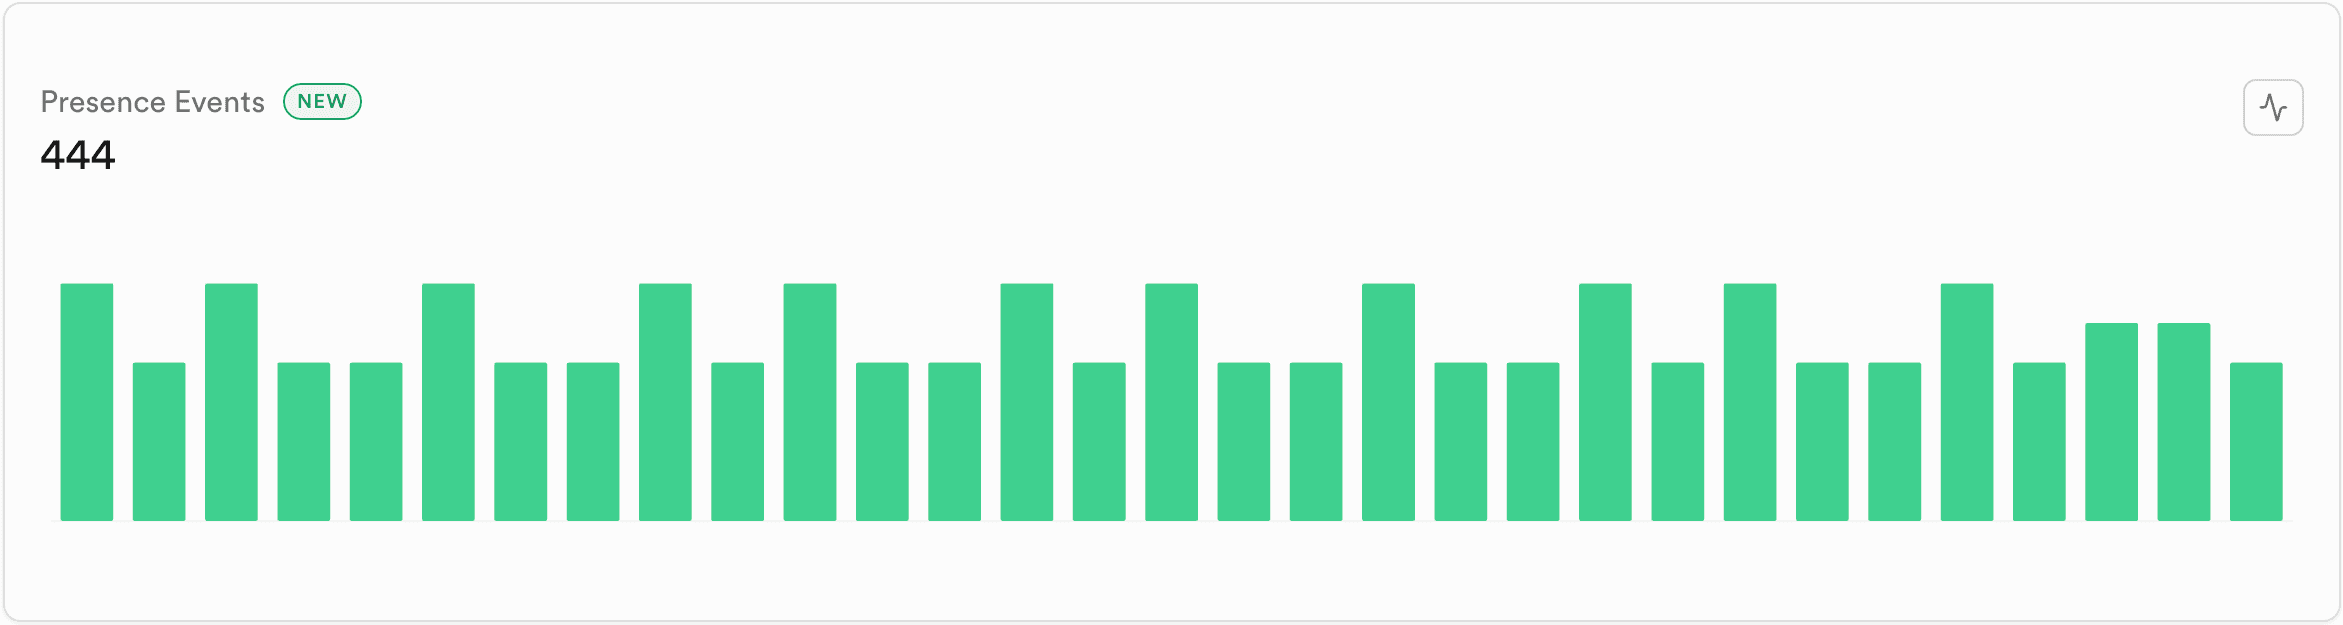
Presence Events#
The Presence Events report helps you monitor the volume of presence state updates sent through your Realtime channels over time. This metric is essential for understanding how your application tracks and synchronizes shared state between users, such as online status, user activity, or custom state information.
The report displays the total number of presence events sent by clients, showing state synchronization activity throughout the selected time period. Presence events occur when clients track, update, or untrack their presence state in a channel, triggering sync, join, or leave events. Unlike broadcast messages, presence state is persisted in the channel so new joiners immediately receive the current state without waiting for other users to send updates.
Actions you can take#
| Action | Description | More information |
|---|---|---|
| Configure presence limits | Adjust the "Max presence events per second" setting to optimize presence state update throughput | Realtime Settings Guide |
| Review quotas | Understand presence messages per second limits (Free: 20, Pro: 50, Pro no spend cap/Team/Enterprise: 1,000) and presence keys per object limits (10 for most plans) | Realtime Quotas Reference |
| Check logs | Investigate presence errors or quota limit issues in your project dashboard | Realtime Logs Dashboard |
| Debug with logger | Enable logging to track presence events and diagnose state synchronization issues | Debugging Realtime with Logger |
| Learn presence basics | Understand how to implement and optimize presence state tracking in your application | Presence Guide |
| Contact support | Request custom quota increases for Enterprise plans or discuss presence requirements | Support Portal |
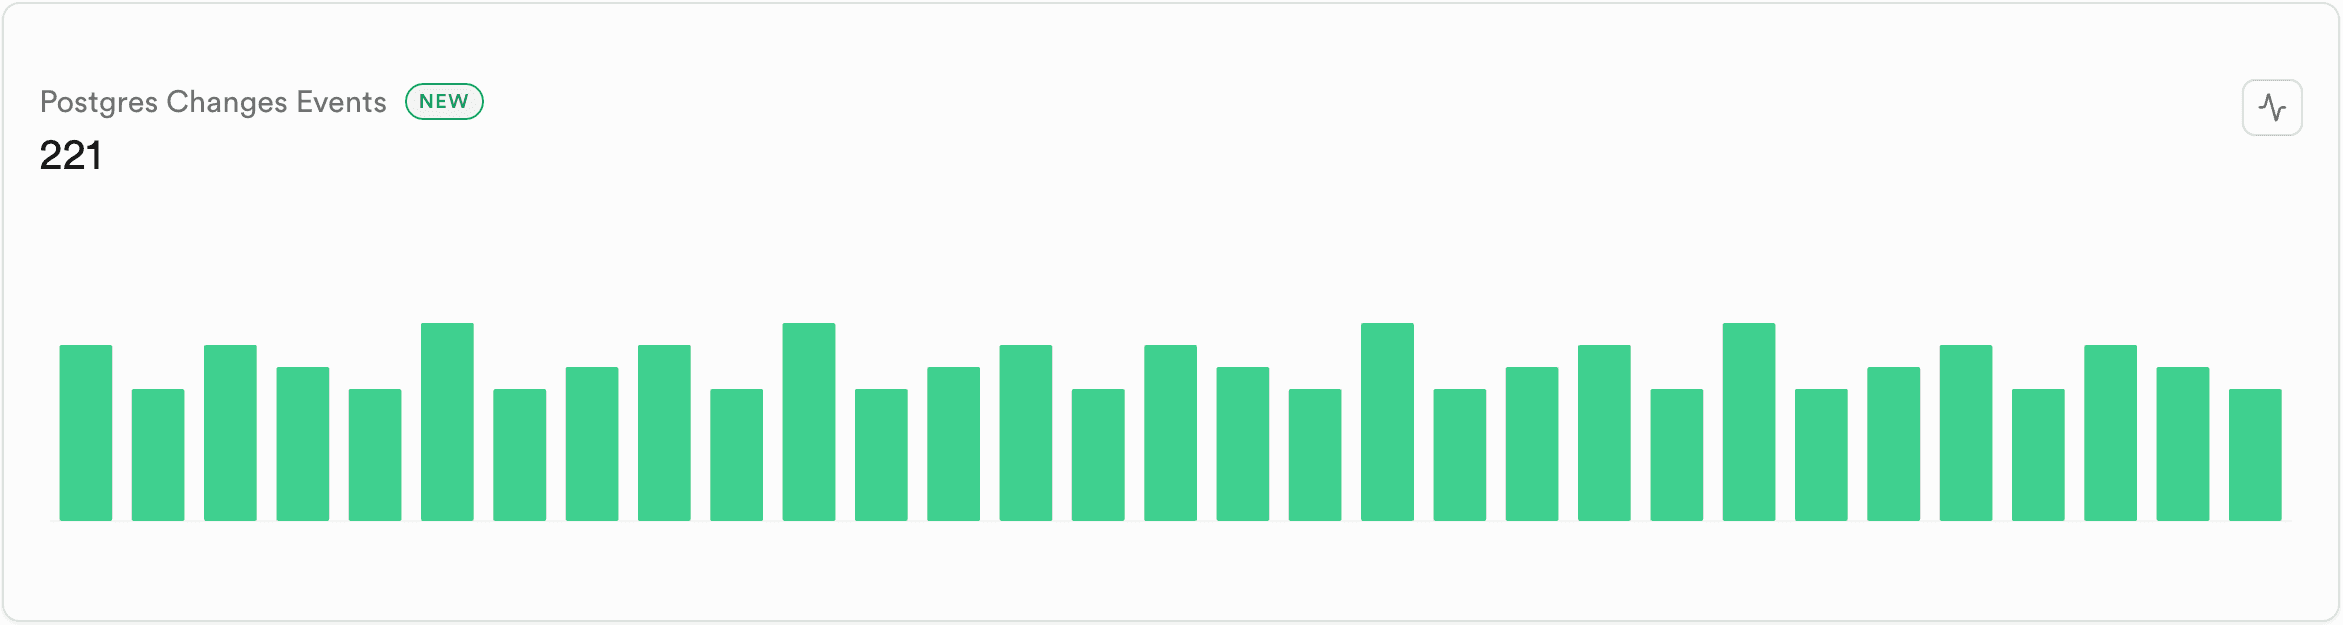
Postgres Changes Events#
The Postgres Changes Events report helps you monitor the volume of database change events (INSERT, UPDATE, DELETE) sent to your Realtime clients over time. This metric is essential for understanding how your application processes database changes and identifying potential performance bottlenecks or scaling issues.
The report displays the total number of Postgres change events received by clients, showing database change activity throughout the selected time period. Postgres Changes use logical replication to stream database changes from the Write-Ahead Log (WAL) to subscribed clients. Each event represents a database change that has been broadcast to clients subscribed to the relevant schema and table. Note that Postgres Changes process changes on a single thread to maintain order, which can create bottlenecks at scale compared to Broadcast.
Actions you can take#
| Action | Description | More information |
|---|---|---|
| Review quotas | Understand Postgres change payload size limits (1,024 KB for all plans) and message throughput limits | Realtime Quotas Reference |
| Check logs | Investigate Postgres Changes errors or performance issues in your project dashboard | Realtime Logs Dashboard |
| Learn Postgres Changes | Understand limitations and best practices for using Postgres Changes | Postgres Changes Guide |
| Migrate to Broadcast | For better scalability, consider using Broadcast with database triggers instead of Postgres Changes | Broadcast Guide |
| Create database triggers | Understand how to create triggers that can send Broadcast messages on database events | Database Triggers Guide |
| Monitor replication | Monitor logical replication health and lag since Postgres Changes reads from the WAL | manual replication monitoring guide |
| Contact support | Discuss scaling strategies or custom solutions for high-volume database change subscriptions | Support Portal |
Rate of Channel Joins#
The Rate of Channel Joins report helps you monitor how fast clients are joining Realtime channels over time. This metric is essential for understanding your application's channel subscription patterns and identifying when you're approaching your plan's channel join rate limits.
The report displays the rate of channel joins per second, showing how frequently clients subscribe to channels throughout the selected time period. A channel join occurs whenever a client subscribes to a channel topic to receive real-time updates. Each client connection can join multiple channels (up to 100 per connection for most plans), and the join rate measures how many of these subscriptions happen per second across your entire project.
Actions you can take#
| Action | Description | More information |
|---|---|---|
| Review quotas | Understand channel joins per second limits (Free: 100, Pro: 500, Pro no spend cap/Team/Enterprise: 2,500) and channels per connection limits (100 for most plans) | Realtime Quotas Reference |
| Check logs | Investigate too_many_joins errors or channel join failures in your project dashboard | Realtime Logs Dashboard |
| Fix channel errors | Learn how to properly manage channel lifecycle and prevent channel leaks in your application | TooManyChannels Error Troubleshooting |
| Learn channel basics | Understand how Realtime channels work and best practices for channel management | Realtime Channels Concepts |
| Contact support | Request custom quota increases for Enterprise plans or discuss high-volume channel join requirements | Support Portal |
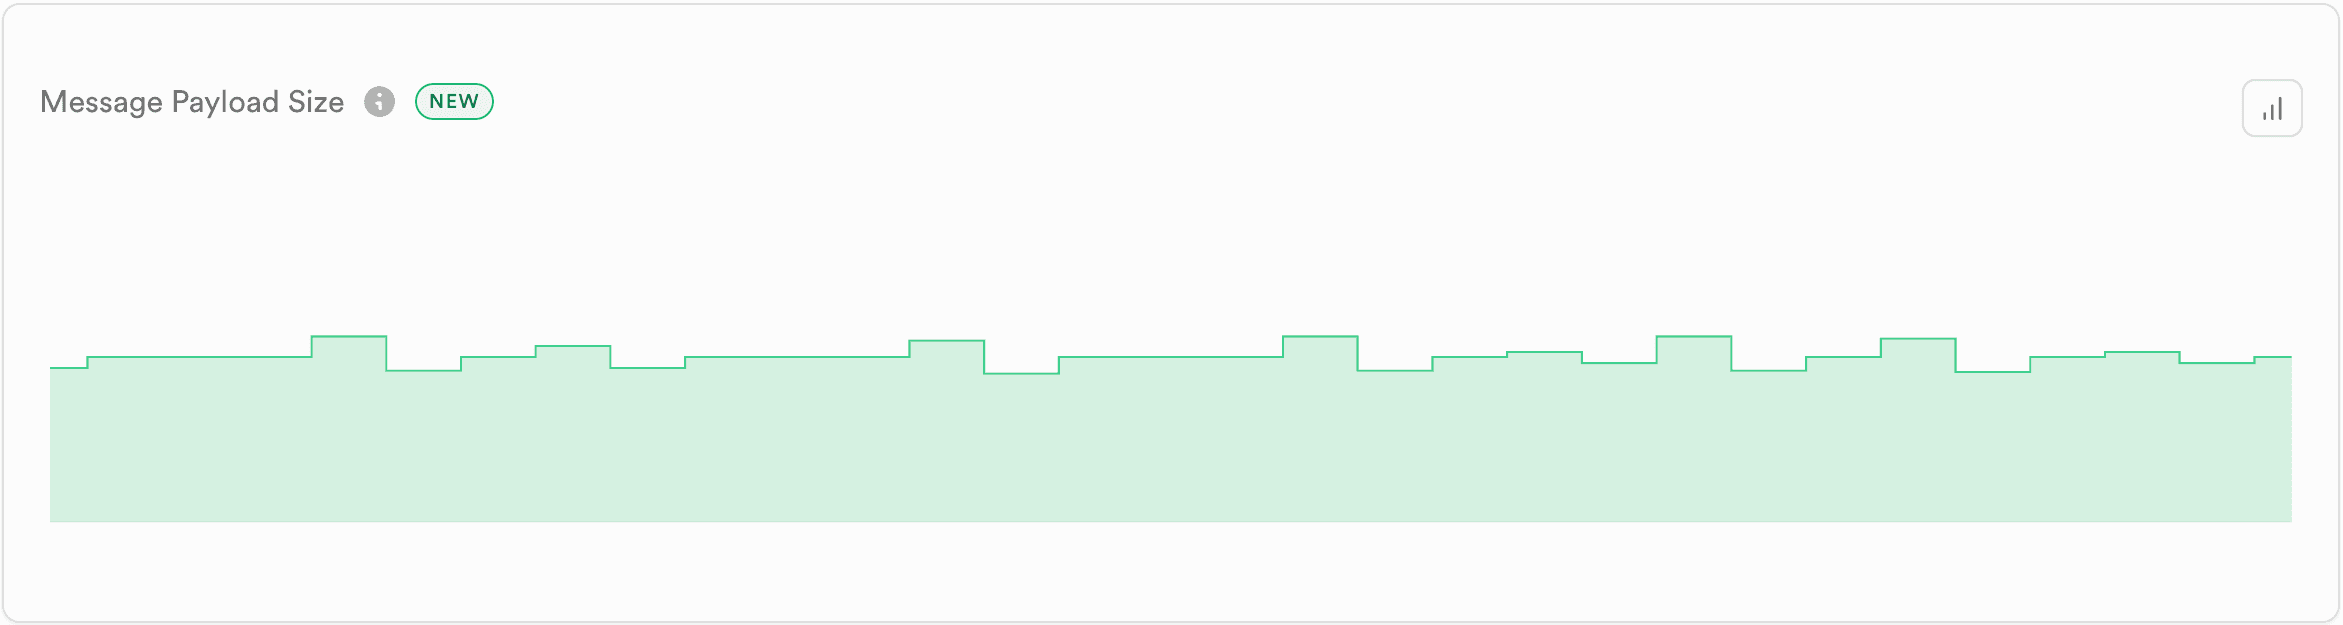
Message Payload Size#
The Message Payload Size report helps you monitor the median size of message payloads sent through your Realtime channels over time. This metric is essential for understanding how message size impacts performance, latency, and bandwidth usage in your real-time application.
The report displays the median payload size in bytes, showing how message sizes fluctuate throughout the selected time period. Payload size directly affects message throughput and latency—larger payloads require more bandwidth and processing time, which can increase latency and reduce the number of messages your system can handle per second. Monitoring this metric helps you optimize your message structure and identify opportunities to reduce payload sizes for better performance.
Actions you can take#
| Action | Description | More information |
|---|---|---|
| Configure payload limits | Adjust the "Max payload size in KB" setting to increase or decrease the maximum message size allowed | Realtime Settings Guide |
| Review quotas | Understand payload size limits: Broadcast (Free: 256 KB, Pro+: 3,000 KB) and Postgres Changes (1,024 KB for all plans) | Realtime Quotas Reference |
| Check logs | Investigate payload-related errors or performance issues in your project dashboard | Realtime Logs Dashboard |
| Review benchmarks | Understand how payload size affects latency and throughput (larger payloads increase latency) | Payload Size Performance Benchmarks |
| Debug query performance | Use explain() to analyze queries and identify performance bottlenecks that may be causing large payloads | Query Performance Debugging Guide |
| Learn broadcast basics | Understand best practices for structuring broadcast messages and optimizing payload sizes | Broadcast Guide |
| Contact support | Discuss payload optimization strategies or custom solutions for high-volume messaging | Support Portal |
Broadcast From Database Replication Lag#
The Broadcast from Database Replication Lag report helps you monitor the median time between when a message is committed to your database and when it's broadcast to Realtime clients. This metric is essential for understanding the latency introduced by the database replication process when using broadcast from database.
The report displays the median replication lag in milliseconds, showing the delay between database commit and broadcast throughout the selected time period. When you use broadcast from database (by inserting messages into realtime.messages), Realtime reads changes from the Write-Ahead Log (WAL) using logical replication. The lag represents the time it takes for these changes to be processed and broadcast to subscribed clients. Higher lag values indicate delays in the replication pipeline, which can impact the real-time responsiveness of your application.
Actions you can take#
| Action | Description | More information |
|---|---|---|
| Check logs | Investigate replication errors or performance issues in your project dashboard | Realtime Logs Dashboard |
| Monitor database | Review database resource utilization, connection counts, and query performance that may affect replication | Database Observability Dashboard |
| Review replication metrics | Use pg_stat_subscription, pg_replication_slots, and other Postgres views to diagnose replication issues | manual replication monitoring guide |
| Debug database issues | Use CLI inspection tools to identify bloat, lock contention, and long-running queries affecting replication | Database Inspection Tools Guide |
| Optimize performance | Optimize query performance and connection management to reduce database load | Performance Tuning Guide |
| Configure timeouts | Configure statement timeouts to prevent long-running transactions from blocking replication | Database Timeouts Guide |
| Learn broadcast from DB | Understand how broadcast from database works and best practices for implementation | Broadcast from Database Guide |
| Contact support | Discuss replication lag issues or request assistance with database performance optimization | Support Portal |
(Read) Private Channel Subscription RLS Execution Time#
The (Read) Private Channel Subscription RLS Execution Time report helps you monitor the median time it takes to execute Row Level Security (RLS) policies when users subscribe to private channels. This metric is essential for understanding how RLS policy complexity impacts channel join latency and overall connection performance.
The report displays the median RLS execution time in milliseconds, showing how long it takes to validate user permissions when subscribing to private channels throughout the selected time period. When a user joins a private channel, Realtime checks RLS policies on the realtime.messages table to determine if the user has read access. This authorization check happens once per channel subscription and the result is cached for the duration of the connection. However, complex RLS policies with joins, function calls, or missing indexes can significantly increase this initial connection time.
Actions you can take#
| Action | Description | More information |
|---|---|---|
| Configure connection pool | Adjust the "Database connection pool size" setting to increase the number of connections available for RLS authorization checks, which can improve performance for high-volume channel subscriptions | Realtime Settings Guide |
| Optimize RLS policies | Learn how to optimize RLS policies with indexes, function wrapping, and query optimization techniques | RLS Performance Best Practices |
| Check logs | Investigate RLS authorization errors or timeout issues in your project dashboard | Realtime Logs Dashboard |
| Learn authorization basics | Understand how RLS policies work with private channels and best practices for implementation | Realtime Authorization Guide |
| Create indexes | Add indexes on columns frequently used in RLS policy conditions to speed up authorization checks | Database Indexes Guide |
| Use index advisor | Automatically detect missing indexes that could improve RLS policy performance | Index Advisor Extension Guide |
| Optimize queries | Learn techniques for optimizing queries including partial indexes and composite indexes for RLS conditions | Query Optimization Guide |
| Monitor database | Review database query performance and identify slow queries that may be affecting RLS execution | Database Observability Dashboard |
| Contact support | Discuss RLS optimization strategies or get assistance with complex authorization requirements | Support Portal |
(Write) Private Channel Subscription RLS Execution Time#
The (Write)Private Channel Subscription RLS Execution Time report helps you monitor the median time it takes to execute Row Level Security (RLS) policies when users publish messages to private channels. This metric is essential for understanding how RLS policy complexity impacts message publishing latency and overall broadcast performance.
The report displays the median RLS execution time in milliseconds, showing how long it takes to validate user permissions when publishing to private channels throughout the selected time period. When a user sends a broadcast message to a private channel, Realtime checks RLS policies on the realtime.messages table to determine if the user has write (INSERT) access. This authorization check happens for the first message sent and then it's cached. Complex RLS policies with joins, function calls, or missing indexes can significantly increase first message publishing latency.

Actions you can take#
| Action | Description | More information |
|---|---|---|
| Configure connection pool | Adjust the "Database connection pool size" setting to increase the number of connections available for RLS authorization checks, which can improve performance for high-frequency message publishing | Realtime Settings Guide |
| Optimize RLS policies | Learn how to optimize RLS policies with indexes, function wrapping, and query optimization techniques | RLS Performance Best Practices |
| Check logs | Investigate RLS authorization errors or timeout issues when publishing messages in your project dashboard | Realtime Logs Dashboard |
| Learn authorization basics | Understand how RLS policies work with private channels for write operations and best practices for implementation | Realtime Authorization Guide |
| Create indexes | Add indexes on columns used in INSERT policies to speed up write authorization checks | Database Indexes Guide |
| Use index advisor | Automatically detect missing indexes that could improve write RLS policy performance | Index Advisor Extension Guide |
| Optimize queries | Learn techniques for optimizing INSERT policy queries including partial indexes for specific conditions | Query Optimization Guide |
| Monitor database | Review database query performance and identify slow queries that may be affecting write RLS execution | Database Observability Dashboard |
| Contact support | Discuss RLS optimization strategies or get assistance with complex authorization requirements for high-frequency messaging | Support Portal |
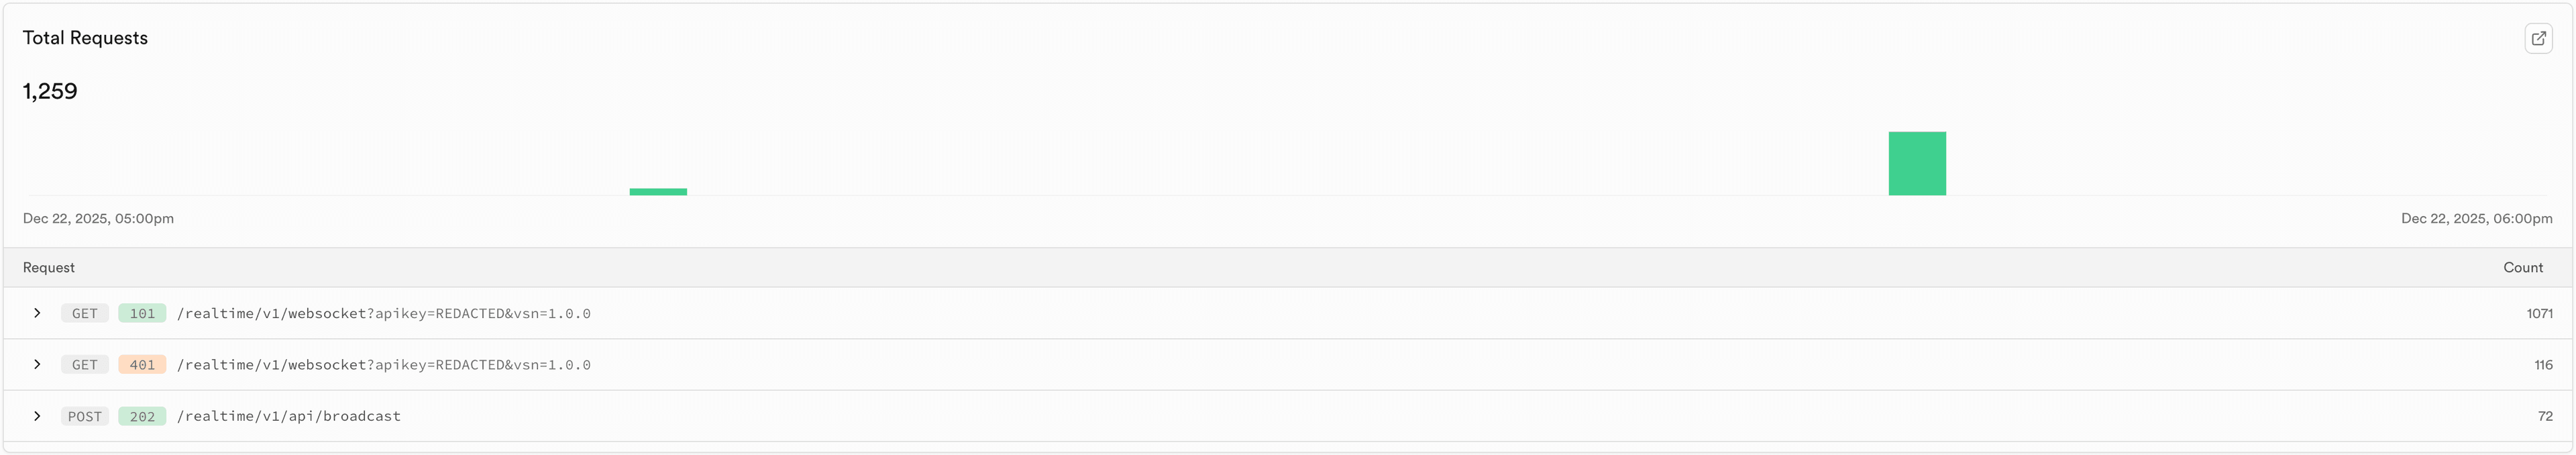
Total Requests#
The Total Requests report helps you monitor the overall volume of HTTP requests for Realtime over time. This metric is essential for understanding your application's usage patterns and identifying traffic trends or potential issues with API request handling.
The report displays the total number of HTTP requests made to the Realtime service which include the WebSocket upgrade requests and the REST API requests.
Actions you can take#
| Action | Description | More information |
|---|---|---|
| Check logs | Investigate request errors or issues in your project dashboard | Realtime Logs Dashboard |
| Review error rates | Compare total requests with error rates to identify failure patterns | Response Errors Report |
| Review response times | Monitor API response times to identify performance bottlenecks | Response Speed Report |
| Learn REST API broadcast | Understand how to send broadcast messages using HTTP requests | Broadcast via REST API Guide |
| Monitor database | Review database resource utilization that may affect API request processing | Database Observability Dashboard |
| Contact support | Discuss high-volume request patterns or get assistance with API optimization | Support Portal |
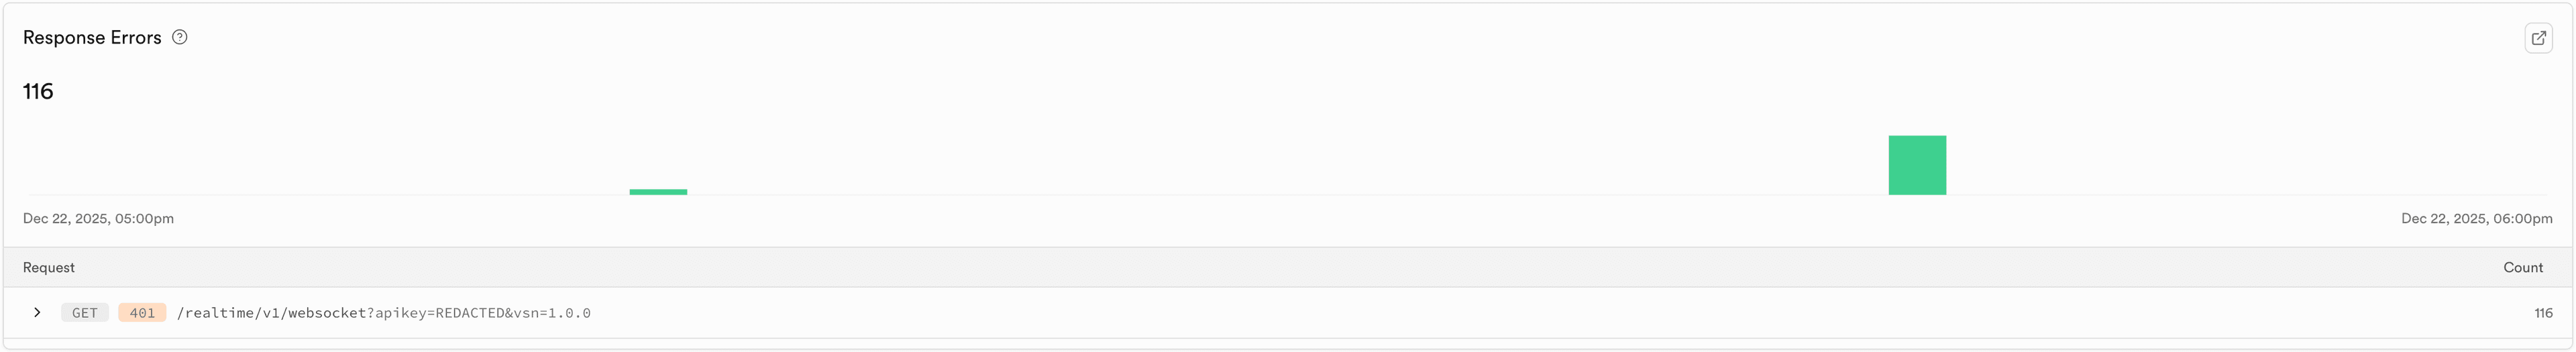
Response Errors#
The Response Errors report helps you monitor the number of failed HTTP requests to the Realtime service over time. This metric is essential for identifying issues with API requests, WebSocket upgrade failures, authentication problems, and other error conditions that may impact your application's real-time functionality.
The report displays the total number of response errors from the Realtime API, showing error frequency throughout the selected time period. These errors include HTTP error status codes (4xx client errors and 5xx server errors) from REST API requests, failed WebSocket upgrade requests, authorization failures, and other error responses. Monitoring error rates alongside total requests helps you identify patterns, correlate errors with specific events, and troubleshoot issues affecting your Realtime service availability.
Actions you can take#
| Action | Description | More information |
|---|---|---|
| Configure limits | Adjust "Max concurrent connections" or "Max events per second" settings if errors are related to quota limits being reached | Realtime Settings Guide |
| Check logs | Investigate specific error messages, error codes, and request details in your project dashboard | Realtime Logs Dashboard |
| Review request volume | Compare error rates with total request volume to calculate error percentages and identify trends | Total Requests Report |
| Understand error codes | Understand specific error codes and their resolutions | Realtime Error Codes Reference |
| Learn HTTP status codes | Learn about HTTP status codes including 4XX client errors and 5XX server errors | HTTP Status Codes Troubleshooting |
| Fix timeout errors | Resolve WebSocket timeout errors caused by Node.js version incompatibility | TIMED_OUT Connection Errors Troubleshooting |
| Understand heartbeats | Monitor heartbeat status to detect connection issues and handle timeouts | Realtime Heartbeats Guide |
| Review quotas | Check if errors are related to quota limits (e.g., too_many_connections, too_many_joins) | Realtime Quotas Reference |
| Learn authorization | Troubleshoot authorization-related errors for private channels | Realtime Authorization Guide |
| Contact support | Get assistance with persistent errors or investigate service-level issues | Support Portal |
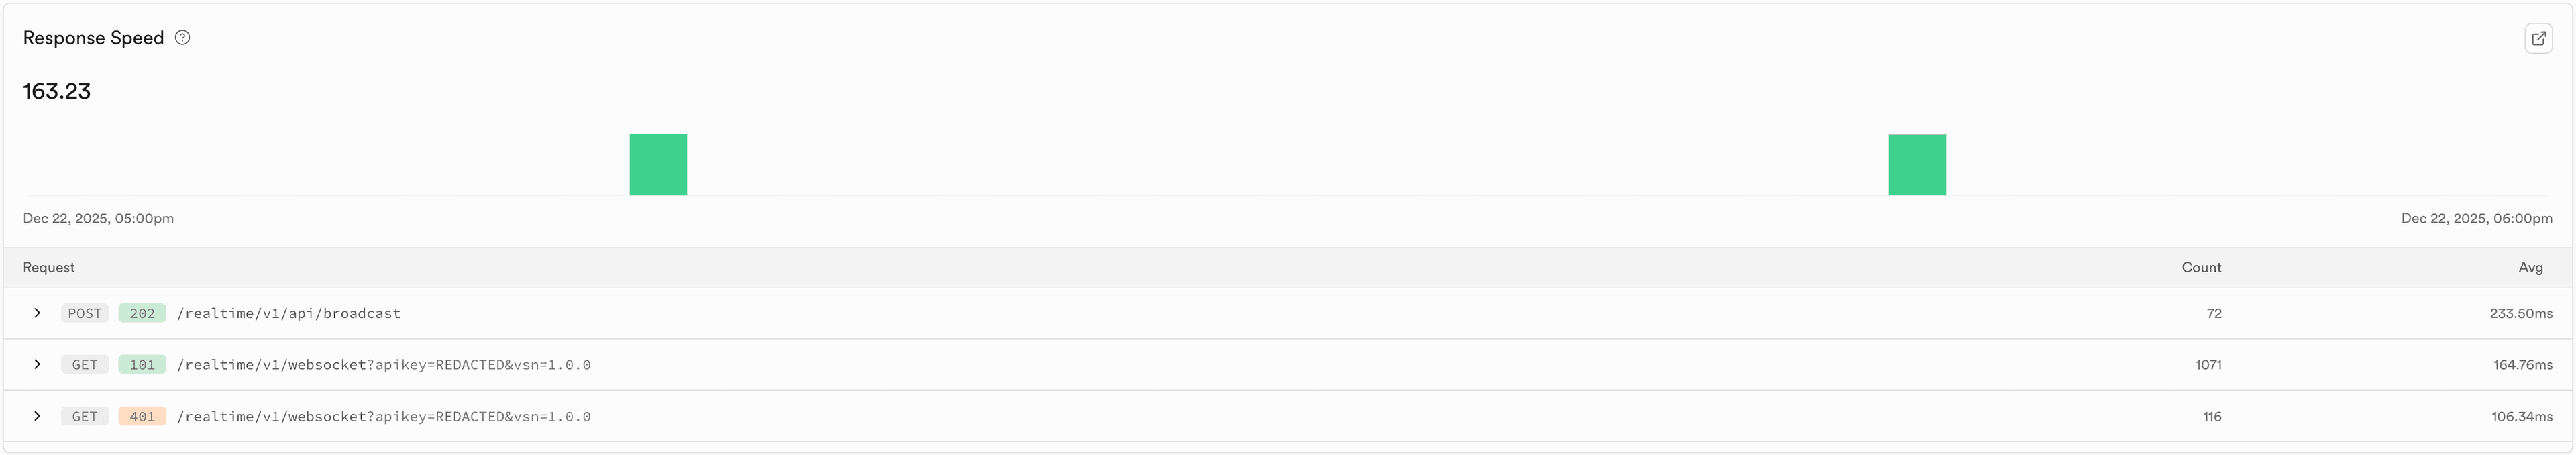
Response Speed#
The Response Speed report helps you monitor the average response time for HTTP requests to the Realtime service over time. This metric is essential for understanding API performance, identifying latency issues, and ensuring your real-time features meet performance expectations.
The report displays the average response time in milliseconds, showing how fast the Realtime service responds to HTTP requests throughout the selected time period. This includes response times for REST API requests such as broadcast messages, WebSocket upgrade requests, and other HTTP-based interactions. Higher response times can indicate performance bottlenecks, database load issues, or network problems that may impact the real-time responsiveness of your application.
Actions you can take#
| Action | Description | More information |
|---|---|---|
| Configure connection pool | Adjust the "Database connection pool size" setting to optimize database connection usage, which can improve response times for authorization checks | Realtime Settings Guide |
| Check logs | Investigate slow requests and identify specific endpoints or operations causing delays | Realtime Logs Dashboard |
| Review request volume | Correlate response times with request volume to identify performance degradation under load | Total Requests Report |
| Monitor database | Review database resource utilization, connection counts, and query performance that may affect response times | Database Observability Dashboard |
| Review benchmarks | Understand expected latency and throughput for different Realtime operations | Realtime Performance Benchmarks |
| Understand heartbeats | Monitor heartbeat status and customize intervals to balance detection speed with network overhead | Realtime Heartbeats Guide |
| Optimize RLS policies | If using private channels, optimize RLS policies that may be slowing down authorization checks | RLS Performance Best Practices |
| Contact support | Discuss performance optimization strategies or investigate persistent latency issues | Support Portal |