Replication Monitoring
Track replication status, view logs, and troubleshoot issues.
Private Alpha
Replication is currently in private alpha. Access is limited and features may change.
After setting up replication, you can monitor the status and health of your replication pipelines directly from the Supabase Dashboard. The pipeline is the active Postgres replication process that continuously streams changes from your database to your destination.
Viewing pipeline status#
To monitor your replication pipelines:
- Navigate to the Database section in your Supabase Dashboard
- Select the replication tab
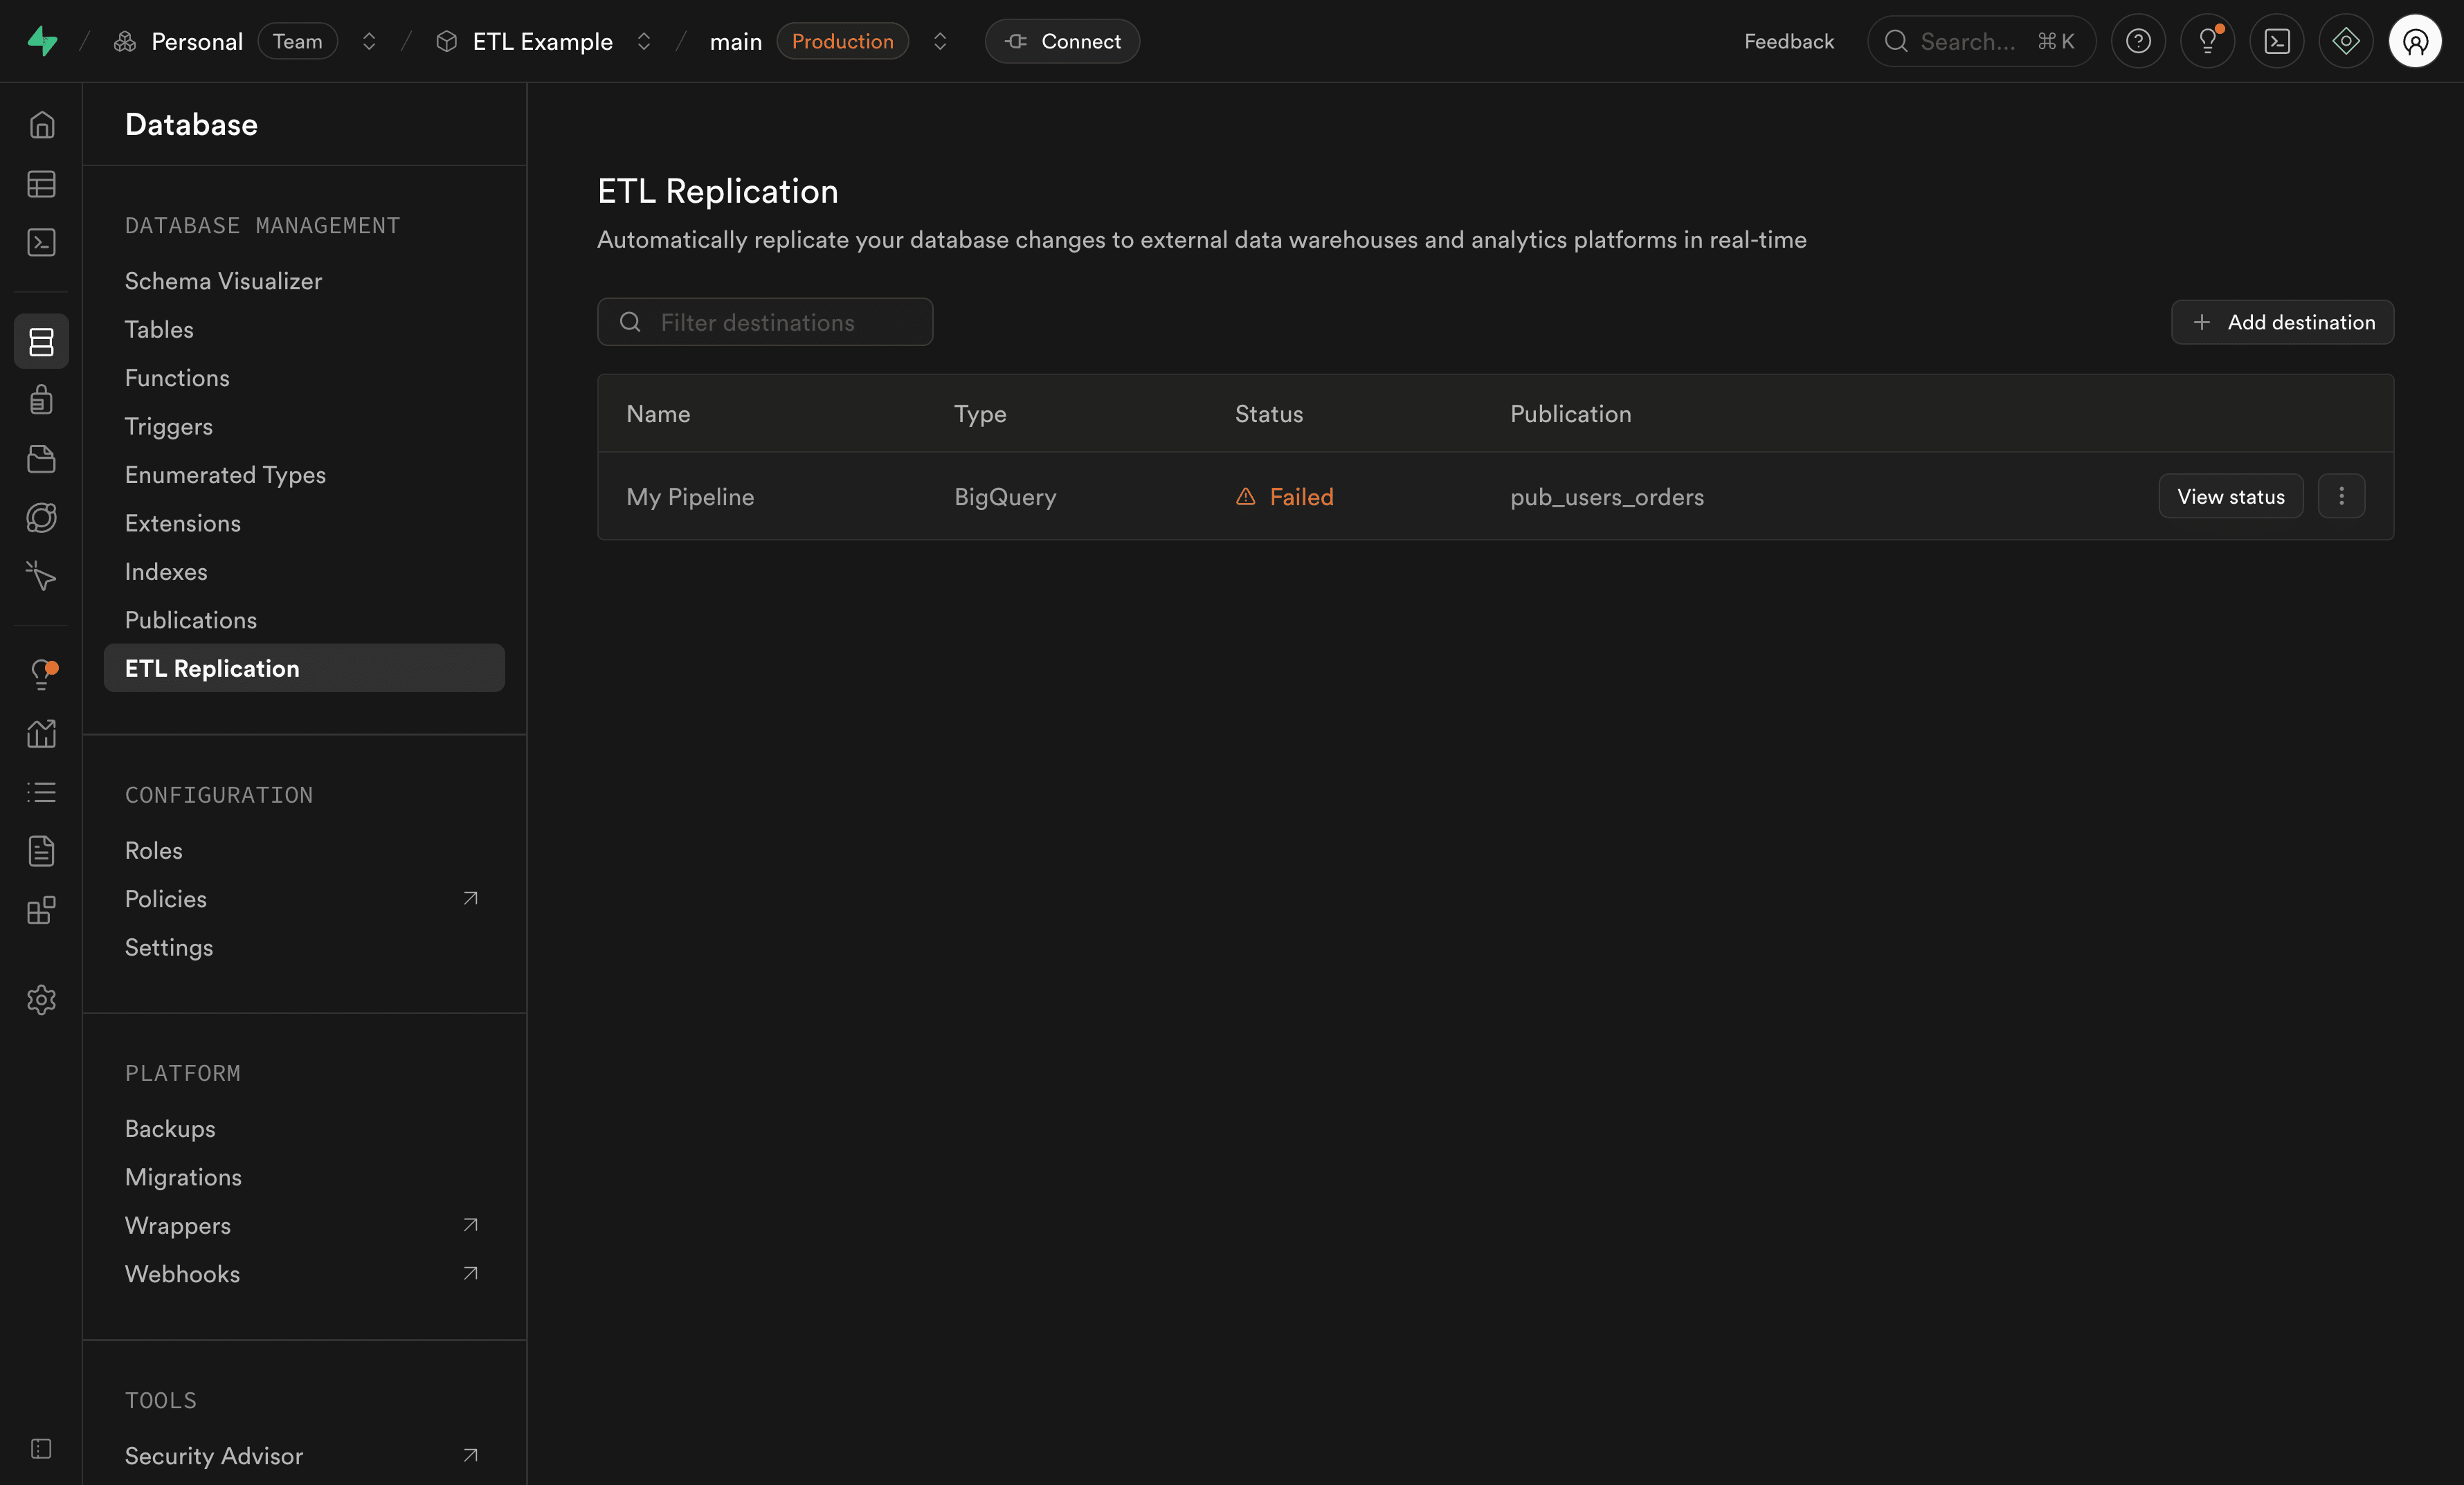
- You'll see a list of all your destinations with their pipeline status

Pipeline states#
Each destination shows its pipeline in one of these states:
| State | Description |
|---|---|
| Stopped | Pipeline is not running |
| Starting | Pipeline is being started |
| Running | Pipeline is actively replicating data |
| Stopping | Pipeline is being stopped |
| Failed | Pipeline has encountered an error (hover over the status to view error details) |
Viewing detailed pipeline metrics#
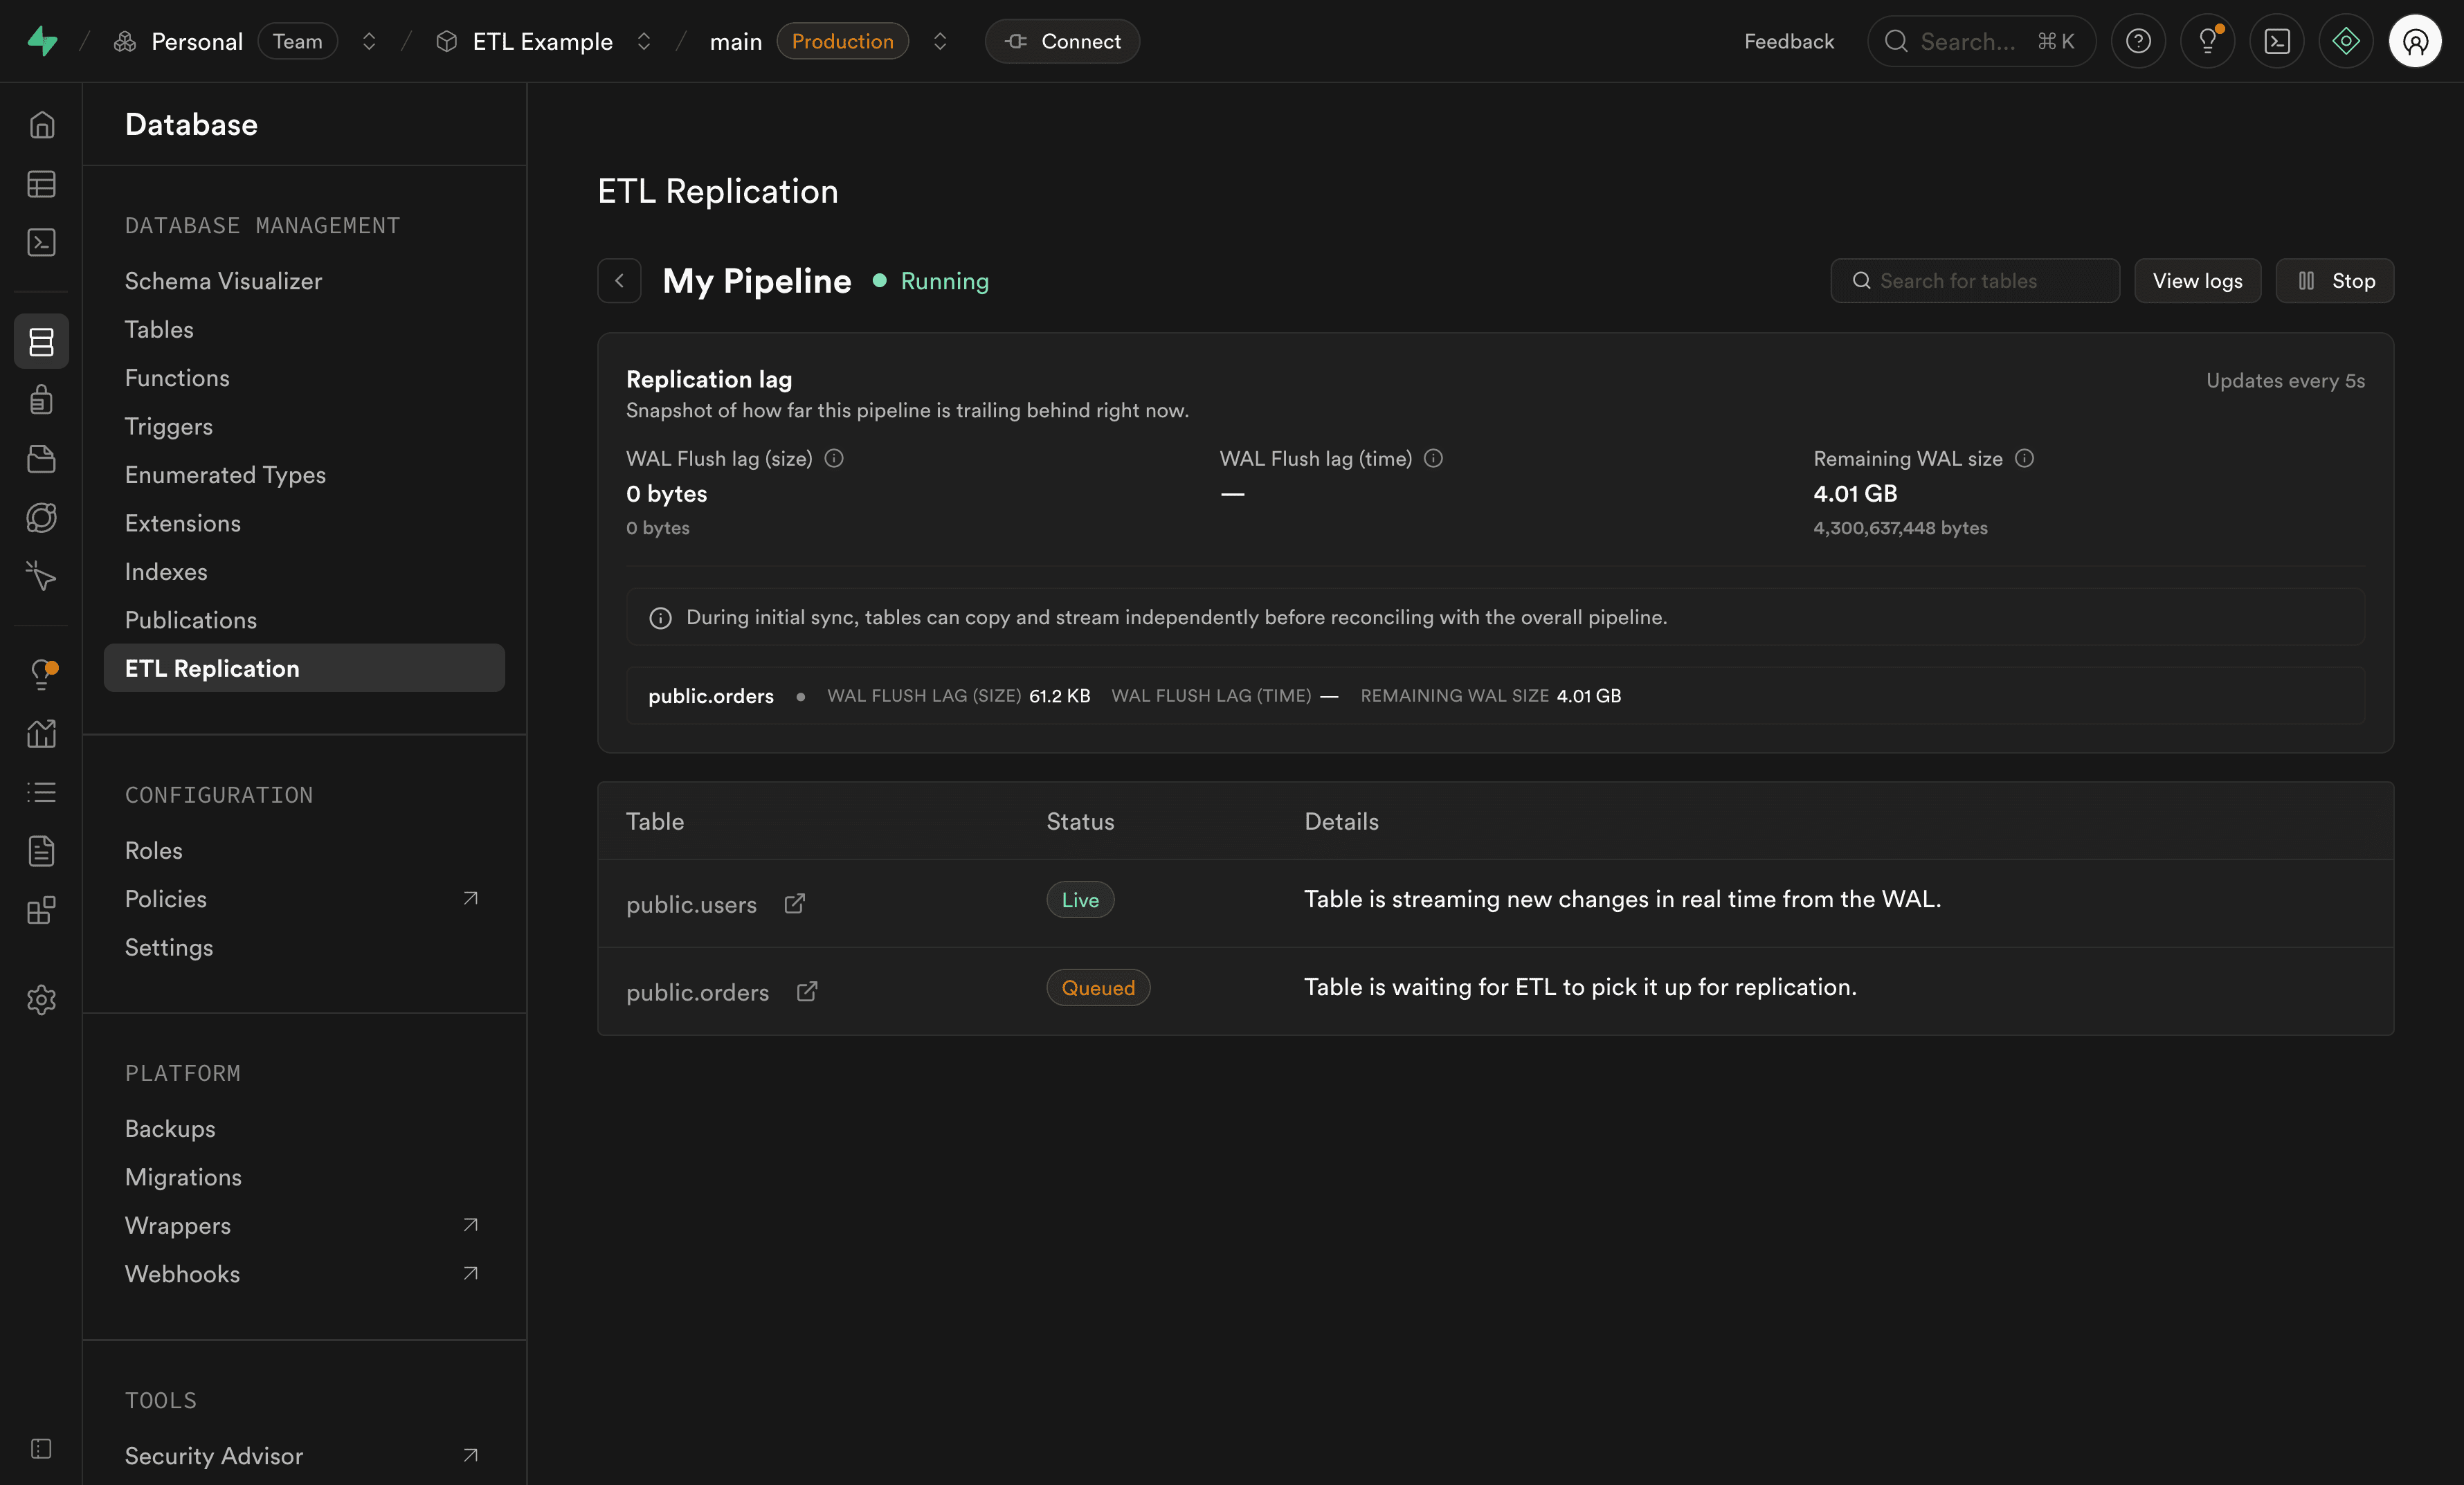
For detailed information about a specific pipeline, click View status on the destination. This opens the pipeline status page where you can monitor replication performance and table states.

Replication lag metrics#
The status page shows replication lag metrics that help you determine how fast your pipeline is replicating data. These metrics are loaded directly from Postgres itself.
Table states#
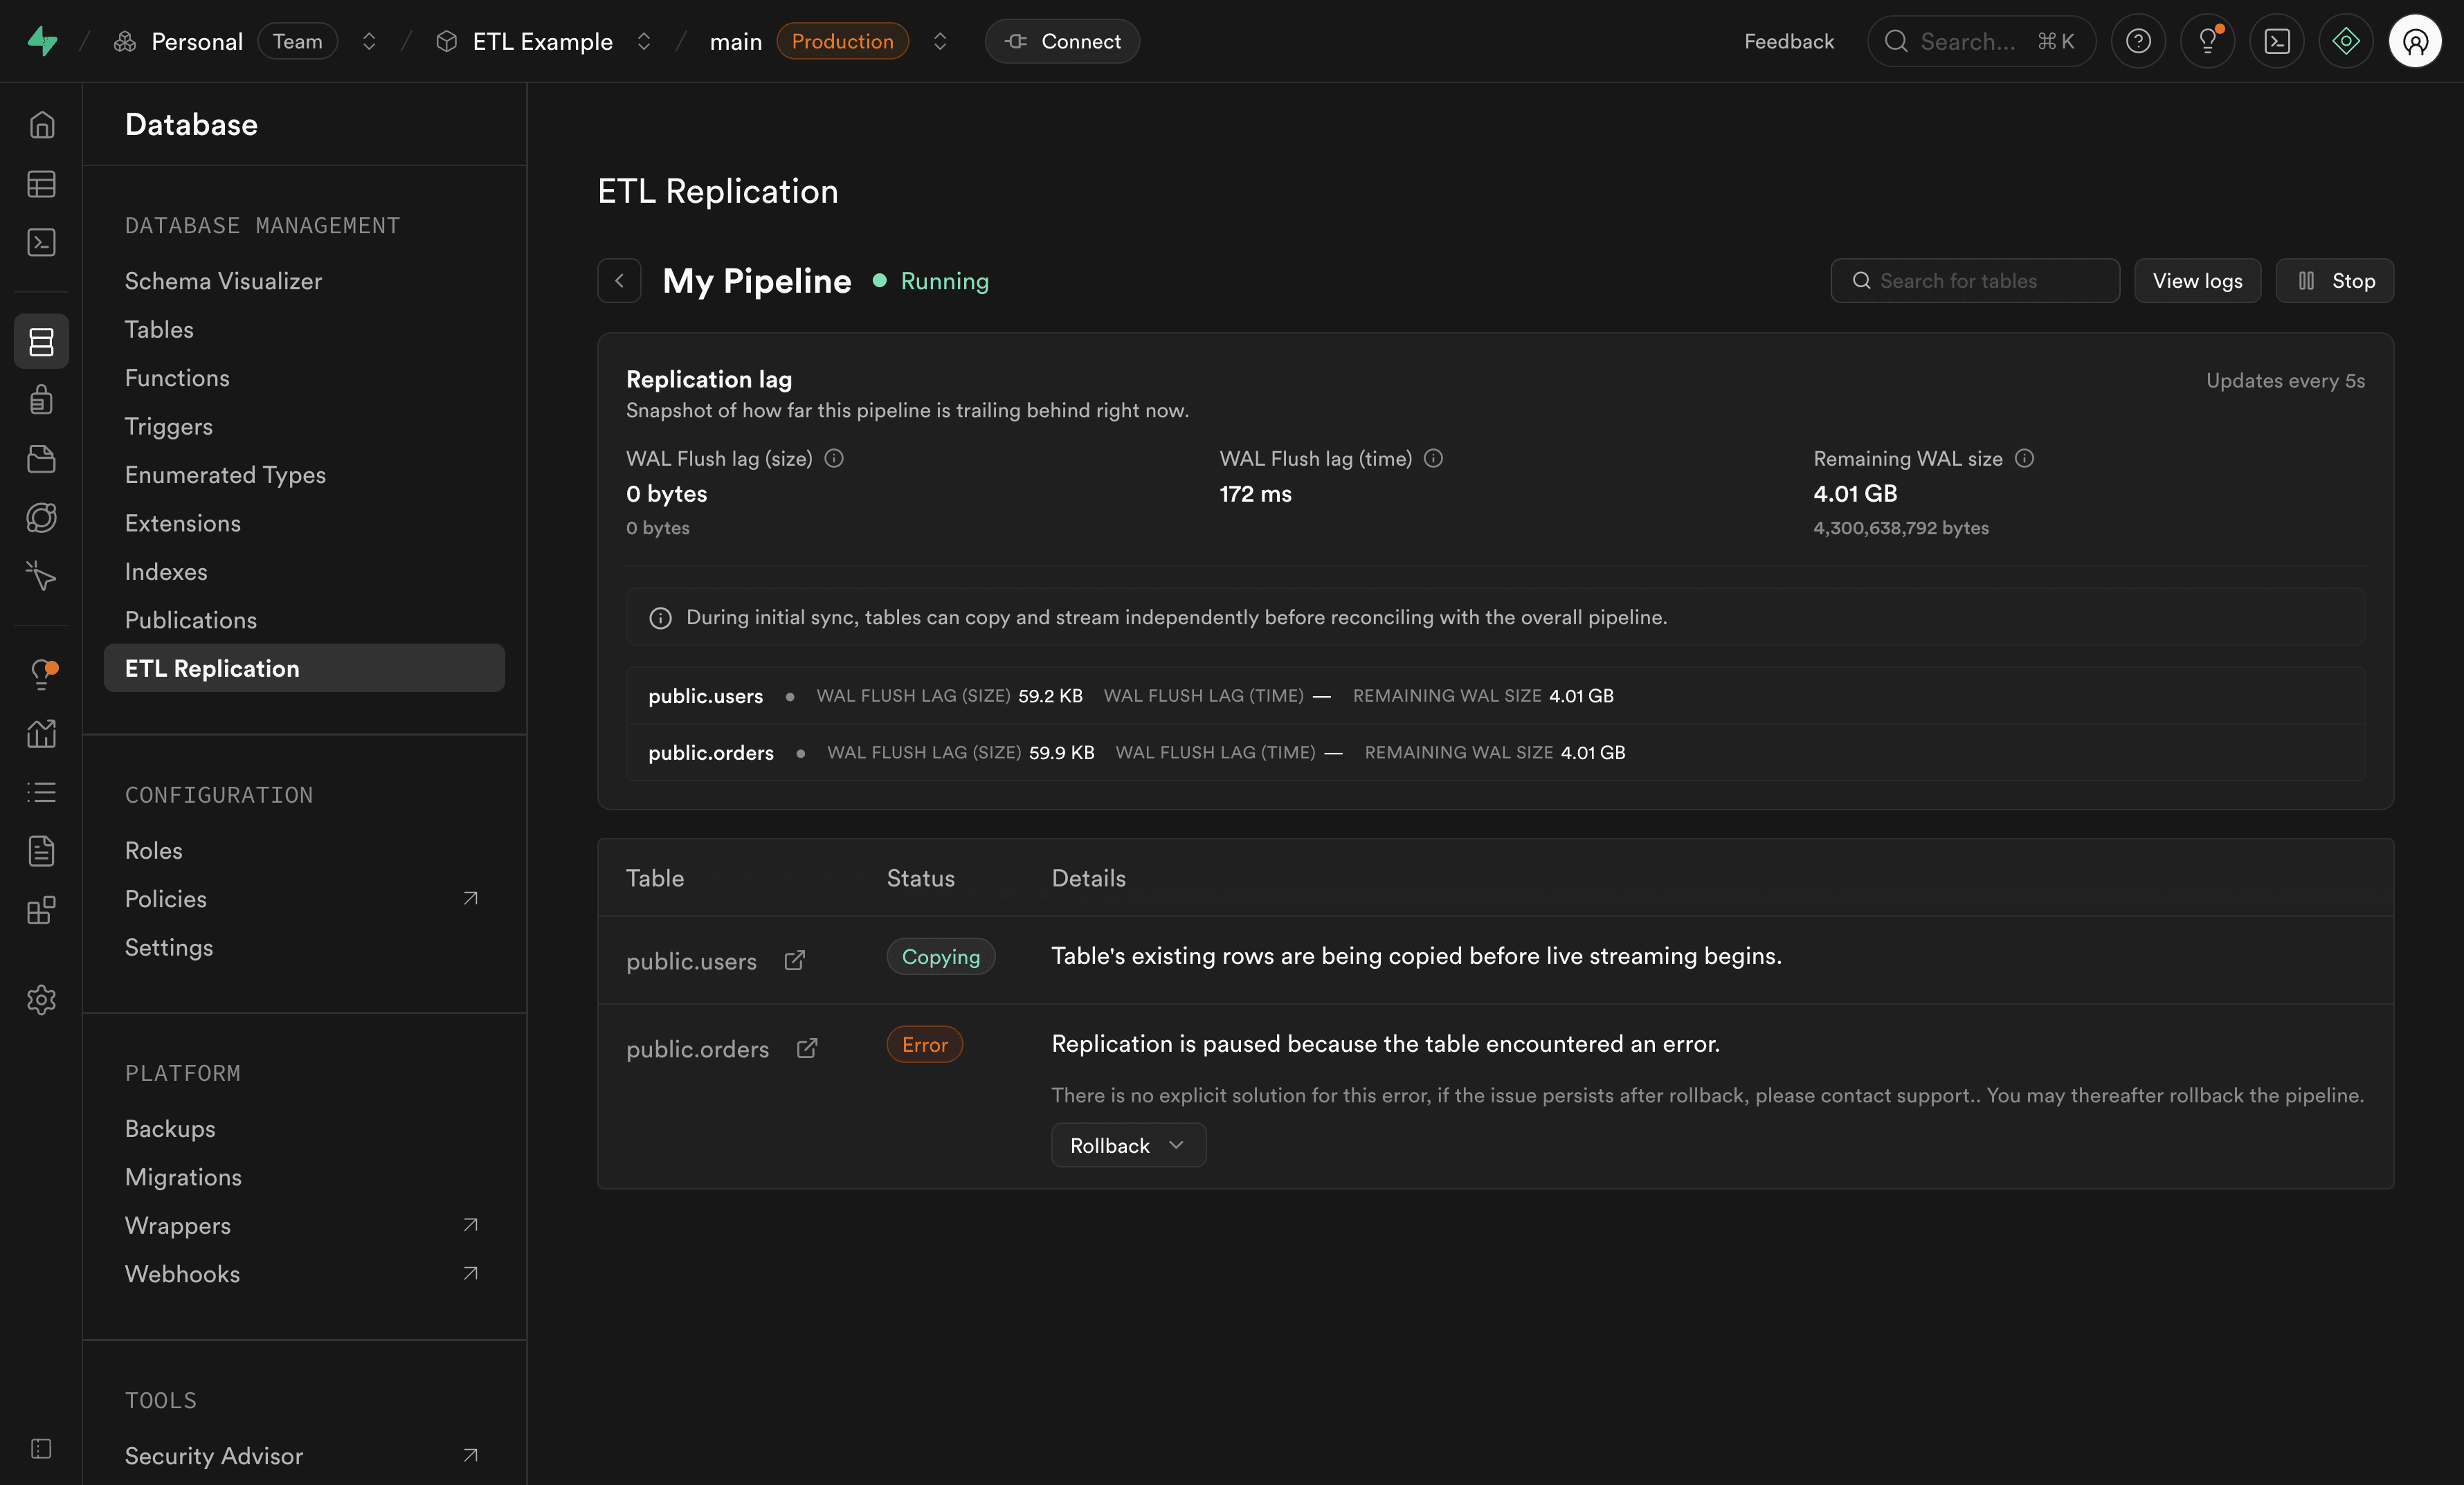
The pipeline status page also shows the state of individual tables being replicated. Each table can be in one of these states:
| State | Description |
|---|---|
| Queue | Table is getting ready to be copied |
| Copying | Initial snapshot of the table is being copied |
| Copied | Table snapshot is complete and getting ready for real-time replication |
| Live | Table is now replicating data in near real-time |
| Error | Table has experienced an error during replication |
Handling errors#
Errors can occur at two levels: per table or per pipeline.
Table errors#
Table errors occur during the copy phase and affect individual tables. These errors can be retried without stopping the entire pipeline.

Viewing table error details:
- Click View status on your destination
- Check the table states section to identify tables in Error state
- Review the error message for that specific table
Recovering from table errors:
When a table encounters an error during the copy phase, you can reset the table state. This will restart the table copy from the beginning.
Pipeline errors#
Pipeline errors occur during the streaming phase (Live state) and affect the entire pipeline. When streaming data, if an error occurs, the entire pipeline will stop and enter a Failed state. This prevents data loss by ensuring no changes are skipped.
When a pipeline error occurs, you'll receive an email notification immediately. This ensures you're promptly notified of any issues so you can take action to resolve them.

Viewing pipeline error details:
- Hover over the Failed status in the destinations list to see a quick error summary
- Click View status for comprehensive error information
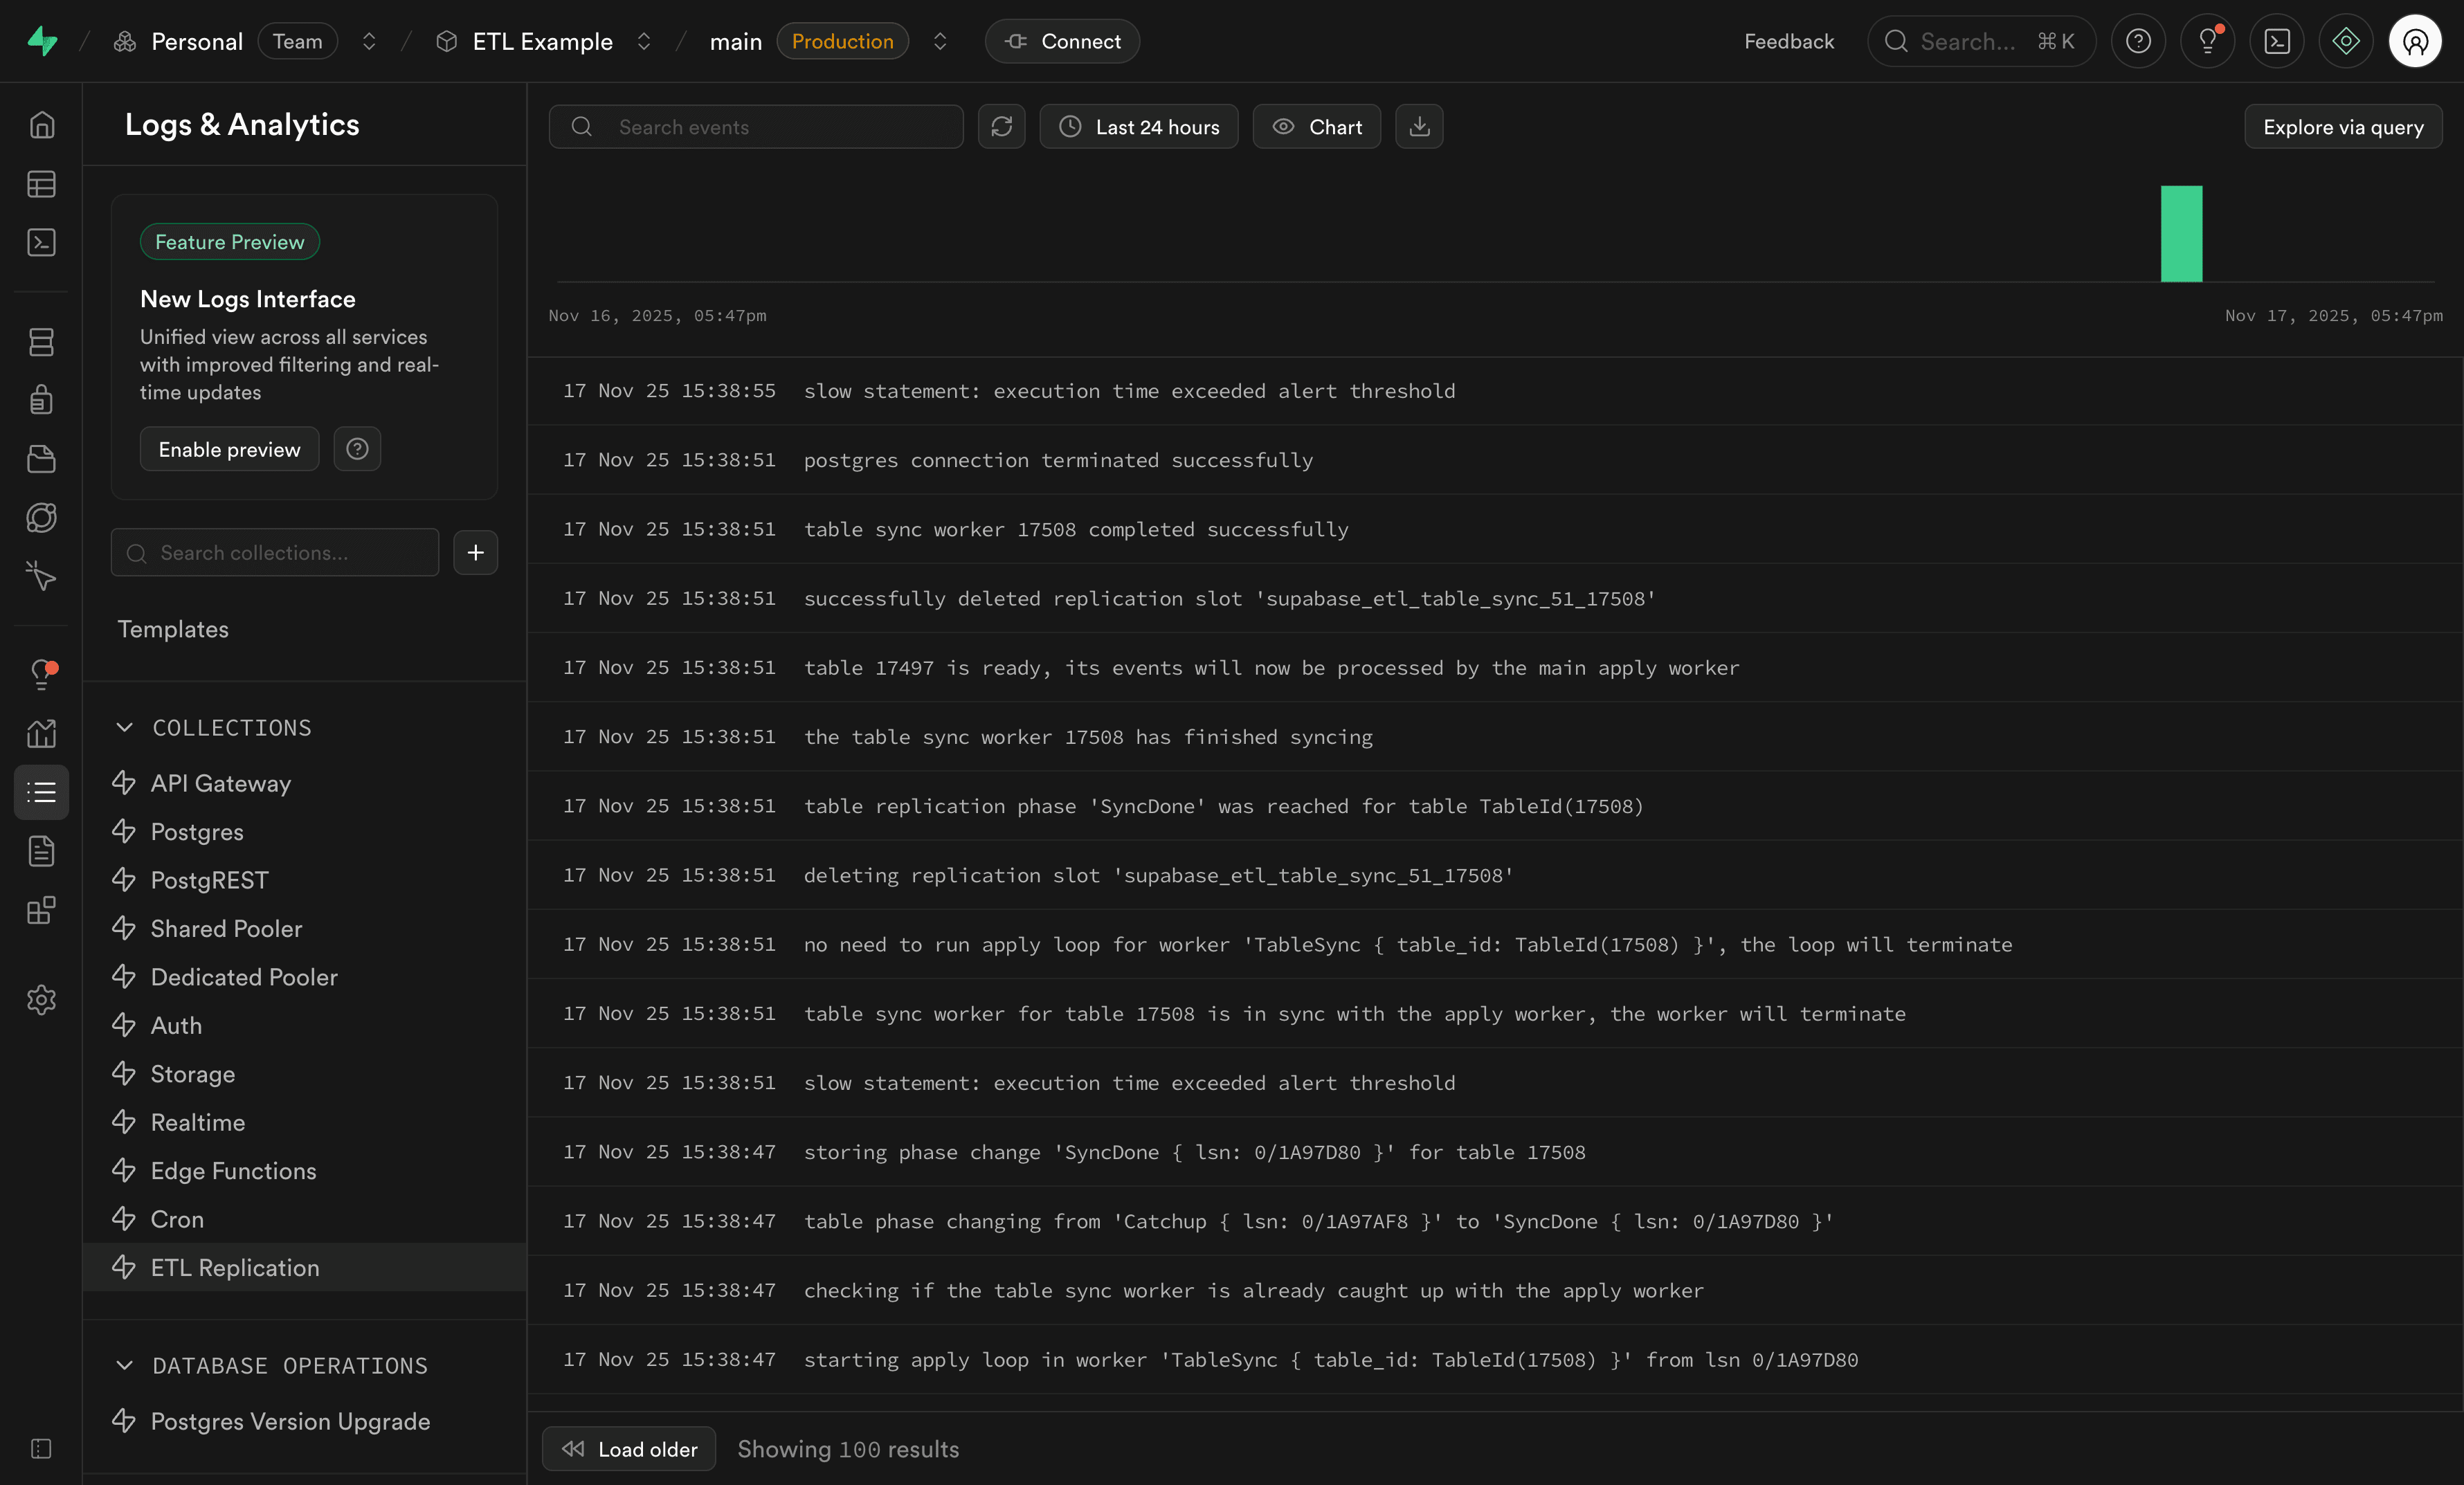
- Navigate to Logs → Replication for detailed error logs
Recovering from pipeline errors:
To recover from a pipeline error, you'll need to:
- Investigate the root cause using the error details and logs
- Fix the underlying issue (e.g., destination connectivity, schema compatibility)
- Restart the pipeline from the destinations list
Viewing logs#
To see detailed logs for all your replication pipelines:
- Navigate to Logs in your Supabase Dashboard
- Select Replication from the log source filter
- You'll see all logs from your replication pipelines

Logs contain diagnostic information that may be too technical for most users. If you're experiencing issues with replication, reaching out to support with your error details is recommended.
Common monitoring scenarios#
Checking if replication is healthy#
- Navigate to Database → replication
- Verify your destination shows Running status
- Click View status to check replication lag and table states
- Ensure all tables show Live state
Investigating errors#
If you see a Failed status:
- Hover over the status to see the error summary
- Click View status to see detailed error information
- Check table states to identify which tables are affected
- Navigate to Logs → Replication for full error details
- For table errors, attempt to reset the affected tables
Monitoring performance#
To ensure optimal performance:
- Regularly check replication lag metrics in the pipeline status view
- Monitor table states to ensure tables are staying in Live state
- Review logs for warnings or performance issues
- If lag is consistently high, consider adjusting your publication or batch wait time settings
Troubleshooting#
If you notice issues with your replication:
- Check pipeline state: Ensure the pipeline is in Running state
- Review table states: Identify tables in Error state
- Check logs: Navigate to Logs → Replication for detailed error information
- Verify publication: Ensure your Postgres publication is properly configured
- Monitor replication lag: High lag may indicate performance issues
For more troubleshooting tips, see the Replication FAQ.