

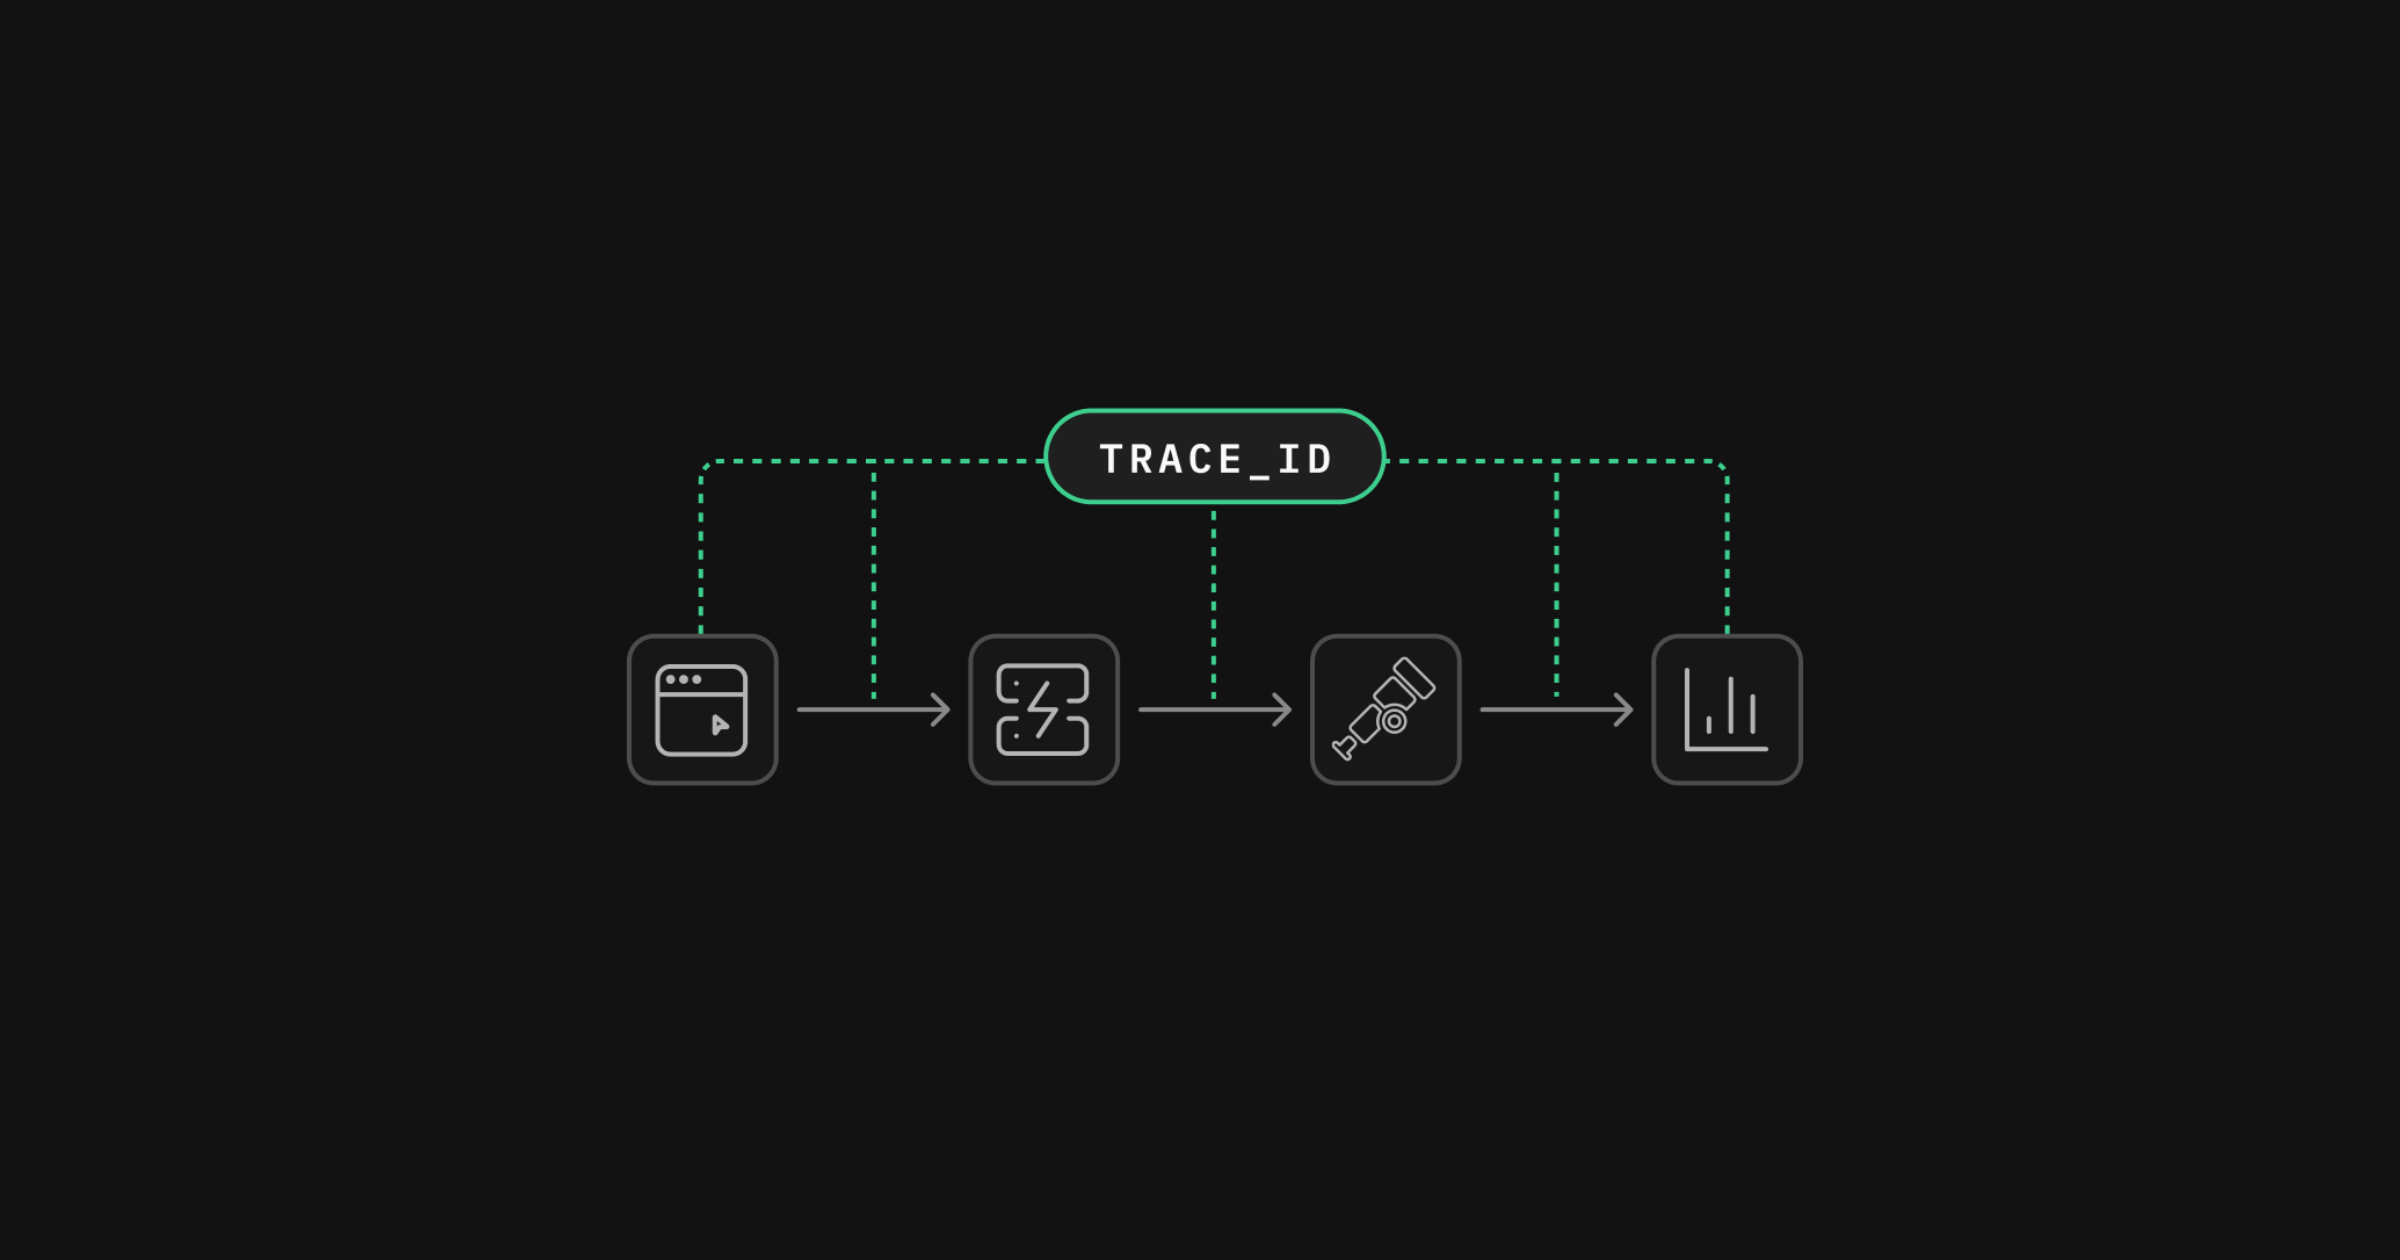
supabase-js now propagates W3C Trace Context to Supabase. Turn it on and the trace_id from your client flows through Supabase's API Gateway and Edge Function logs, so you can follow one request from the browser into your backend logs.
Say a frontend trace shows a slow request leaving the browser, and a Supabase log shows the matching request on the server. Up to now nothing connected the two: the SDK made the call, Supabase logged it, and the two records lived in separate systems with no shared identifier. Debugging across that boundary meant lining up timestamps by hand.
Now, when tracePropagation is enabled, the SDK attaches three standard headers to requests aimed at Supabase domains:
traceparenttracestatebaggage
Supabase reads the incoming trace context and stamps the same trace_id onto the logs it generates. Any W3C-compliant tracer (OpenTelemetry, Sentry, Datadog, Honeycomb, Grafana) picks the trace back up on the server side.
How to set it up#
This walkthrough covers supabase-js. Trace propagation is also available in Swift, Flutter, and Python; see the docs for per-language setup and the current list.
The SDK doesn't configure OpenTelemetry for you. You bring your own tracer, then tell the client to propagate.
First, set up OpenTelemetry as you normally would: install an SDK (@opentelemetry/sdk-trace-node for Node, @opentelemetry/sdk-trace-web for the browser), add an exporter, and register a TracerProvider globally. The tracing runtime needs @opentelemetry/api resolvable in your app, install it directly if your package manager doesn't pull it in alongside the SDK.
Then load the tracing runtime once at your application entry point, and enable propagation on the client:
_10import '@supabase/supabase-js/tracing'_10import { createClient } from '@supabase/supabase-js'_10_10const supabase = createClient(SUPABASE_URL, SUPABASE_KEY, {_10 tracePropagation: true,_10})
The main bundle ships no OpenTelemetry code, that first import is what wires it up.
Wrap your Supabase calls in an active span so there's a trace to propagate:
_10await tracer.startActiveSpan('load-dashboard', async (span) => {_10 const { data } = await supabase.from('profiles').select('*')_10 span.end()_10})
If your sampler drops most traces and you still want Supabase requests carried through, override the sampling decision:
_10import '@supabase/supabase-js/tracing'_10_10const supabase = createClient(SUPABASE_URL, SUPABASE_KEY, {_10 tracePropagation: { enabled: true, respectSamplingDecision: false },_10})
Get more value from your Log Drains#
Log Drains forward your Supabase logs to an external backend. With trace propagation on, every drained log carries the same trace_id as your client and server traces, so you can join them in the tracing UI you already run.
When you do so, the browser span in Sentry and the matching API Gateway log forwarded to Datadog line up under one trace_id. For self-hosted setups running an OpenTelemetry collector, it's the same join on infrastructure you control.
Nothing to pay for if you don't use it#
The OpenTelemetry integration lives behind its own entry point, so the main supabase-js bundle contains zero OpenTelemetry code. Nothing is added to your bundle, and nothing to resolve at build time, unless you opt in. That keeps React Native/Hermes, Metro, and edge bundlers unaffected, and it means that when you do opt in, your bundler can actually see the dependency and include it.
Current limitations#
- No CDN/UMD support. The tracing runtime can't be loaded from a script tag, so trace propagation isn't available in the CDN build.
- Available in supabase-js, Swift, Flutter, and Python.
- Supabase domains only. Headers are attached to your project host,
*.supabase.co,*.supabase.in, and local dev hosts (localhost,127.0.0.1,[::1]), never to third-party hosts, even through a customfetch. - API Gateway and Edge Function logs. Those are the log sources that pick up the
trace_idtoday. - Needs a real span. With no active span at request time, or no registered
TracerProvider(the API defaults to a noop provider), there is nothing to propagate and the SDK no-ops silently. - Sampling is respected by default. Unsampled traces send no headers unless you set
respectSamplingDecision: false.
Getting started#
Trace propagation is available now in supabase-js. Add import '@supabase/supabase-js/tracing' at your entry point, turn on tracePropagation, point your existing tracer at it, and your client traces will line up with your Supabase logs.
Already using tracePropagation from an earlier release? Upgrade to supabase-js 2.112.0 or later and add the import '@supabase/supabase-js/tracing' line. Versions 2.106.0 through 2.111.x silently sent no trace headers in bundled apps, so the upgrade is what actually fixes propagation, not just the import.
Full setup, including the sampling options, is in the client-side tracing guide.