


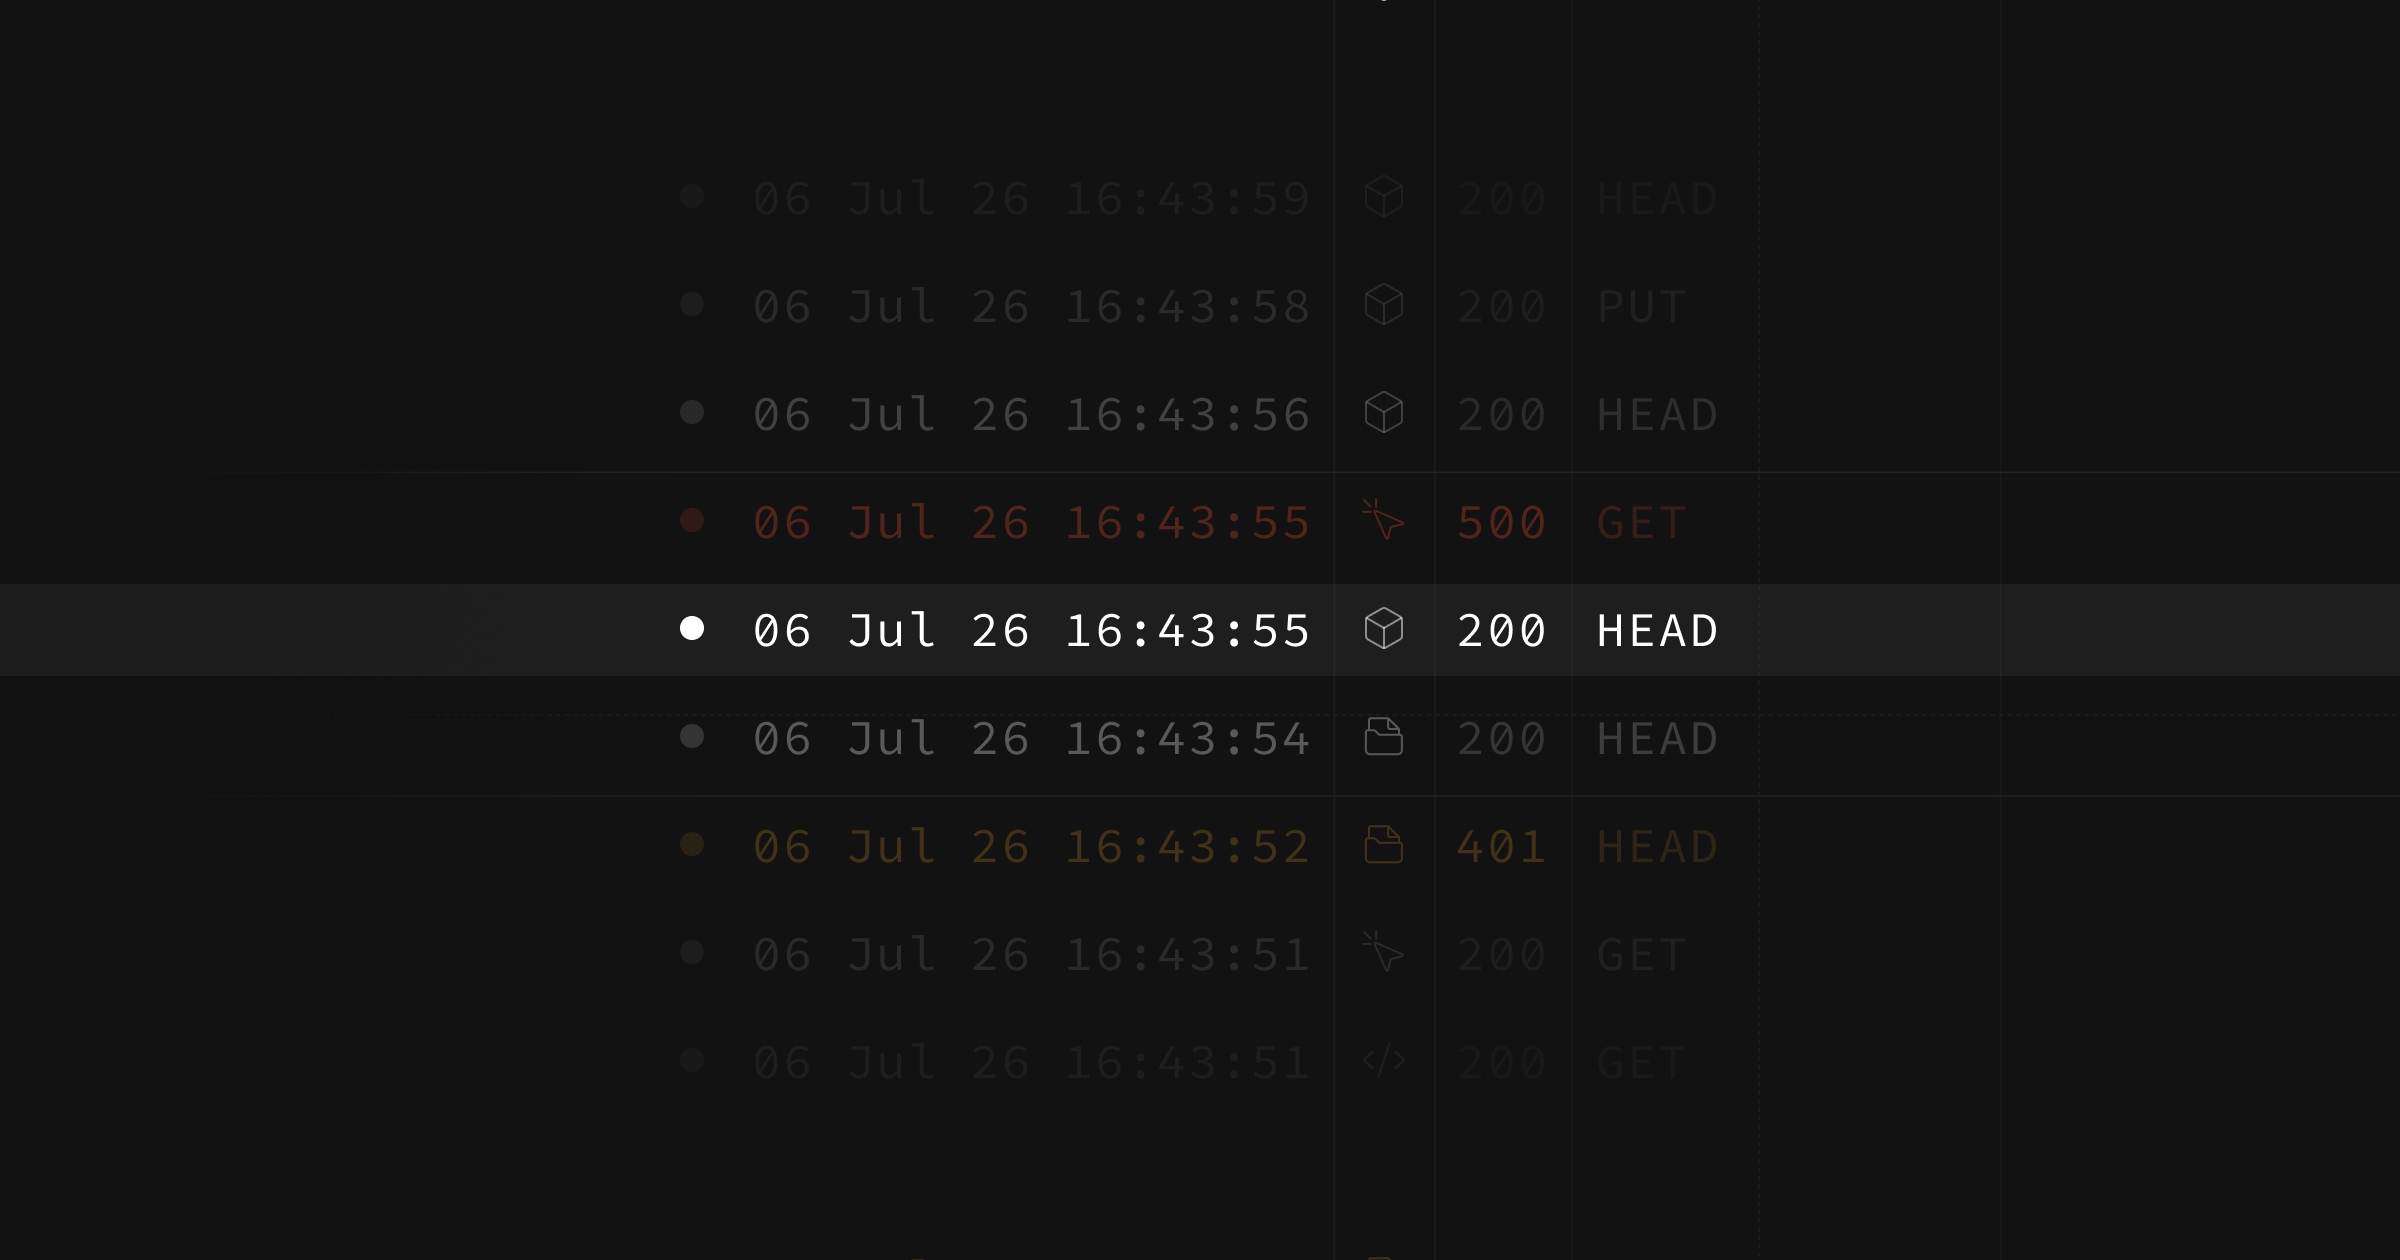
Today Unified Logs enters open beta. It brings logs from every service in your project into one searchable view: the API gateway, Postgres, Auth, Storage, PostgREST, Realtime, and the connection poolers.
Before this, debugging a single request meant jumping between separate log pages. You checked the API gateway logs, then Postgres logs, then Auth logs, each with its own filters and its own tab. Correlating a request across services was slow, and by the time you found the right page the context was gone.
Unified Logs puts all of that in one place.
One stream across your services#
Open Logs in the dashboard and you see every event as it happens, newest first. Each row shows the timestamp, the service, the method, the path, and the status. One row might be an API request, the next a Postgres connection, the next an Auth event, all in the same table.
The sidebar lets you narrow the stream by log type. Turn off Storage and Realtime to focus on Postgres. Turn everything back on to see the full picture. The counts next to each type update as you filter, so you know how much traffic each service is producing.
Filter and search#
The filter bar at the top understands the shape of your logs. Filter by log type, level, status, method, or pathname, and combine those filters however you need. You can also run a free-text search across the event message to find a specific request.
Filters live in the URL, so you can share a link to exactly what you are looking at with a teammate.
Live tail#
Click Live to stream new events into the table as they arrive. This is the fastest way to watch a deploy, reproduce a bug, or confirm that traffic is reaching the right service. Stop the stream at any point to inspect what you have without new rows pushing it down.
A timeline you can read#
The histogram above the table shows log volume over your selected time range, colored by level so errors and warnings stand out from successful requests. A spike in red tells you where to look. Select a range on the timeline to zoom into that window.
Follow a request through every service#
Click a row to open the detail panel. Instead of a wall of JSON, you see the request as it moved through your project: the network timing, the gateway, the database query, the Auth check. Each service adds its own block with the fields that matter. The raw JSON is still there in a second tab when you need it.
Send logs anywhere#
Unified Logs is for debugging inside the dashboard. When you want to keep logs long term or pull them into your own observability tooling, set up a Log Drain and forward events to the destination of your choice.
Try it#
Unified Logs is rolling out to all projects during open beta. Open the Logs section of your project to start using it. If you want the previous experience back, the "Go back to old logs" button switches you to the classic Logs Explorer at any time.
This is a beta, and we want your feedback. Tell us what is missing, what is slow, and what you want to filter on next.