
Elastic
Overview
Elastic Observability is a unified platform for monitoring logs, metrics, and traces across your full technology stack. It brings data from every layer of your infrastructure into Elasticsearch for centralized search, visibility, and alerting.
As Supabase projects grow, teams need to see how the database, connection pooler, API, auth, realtime, and storage layers are behaving without stitching together separate tools. The Elastic integration collects metrics and logs from all of them using OpenTelemetry, pulling Prometheus-formatted metrics from the Supabase Metrics API and structured logs from Supabase services. No additional agent is required on your infrastructure.
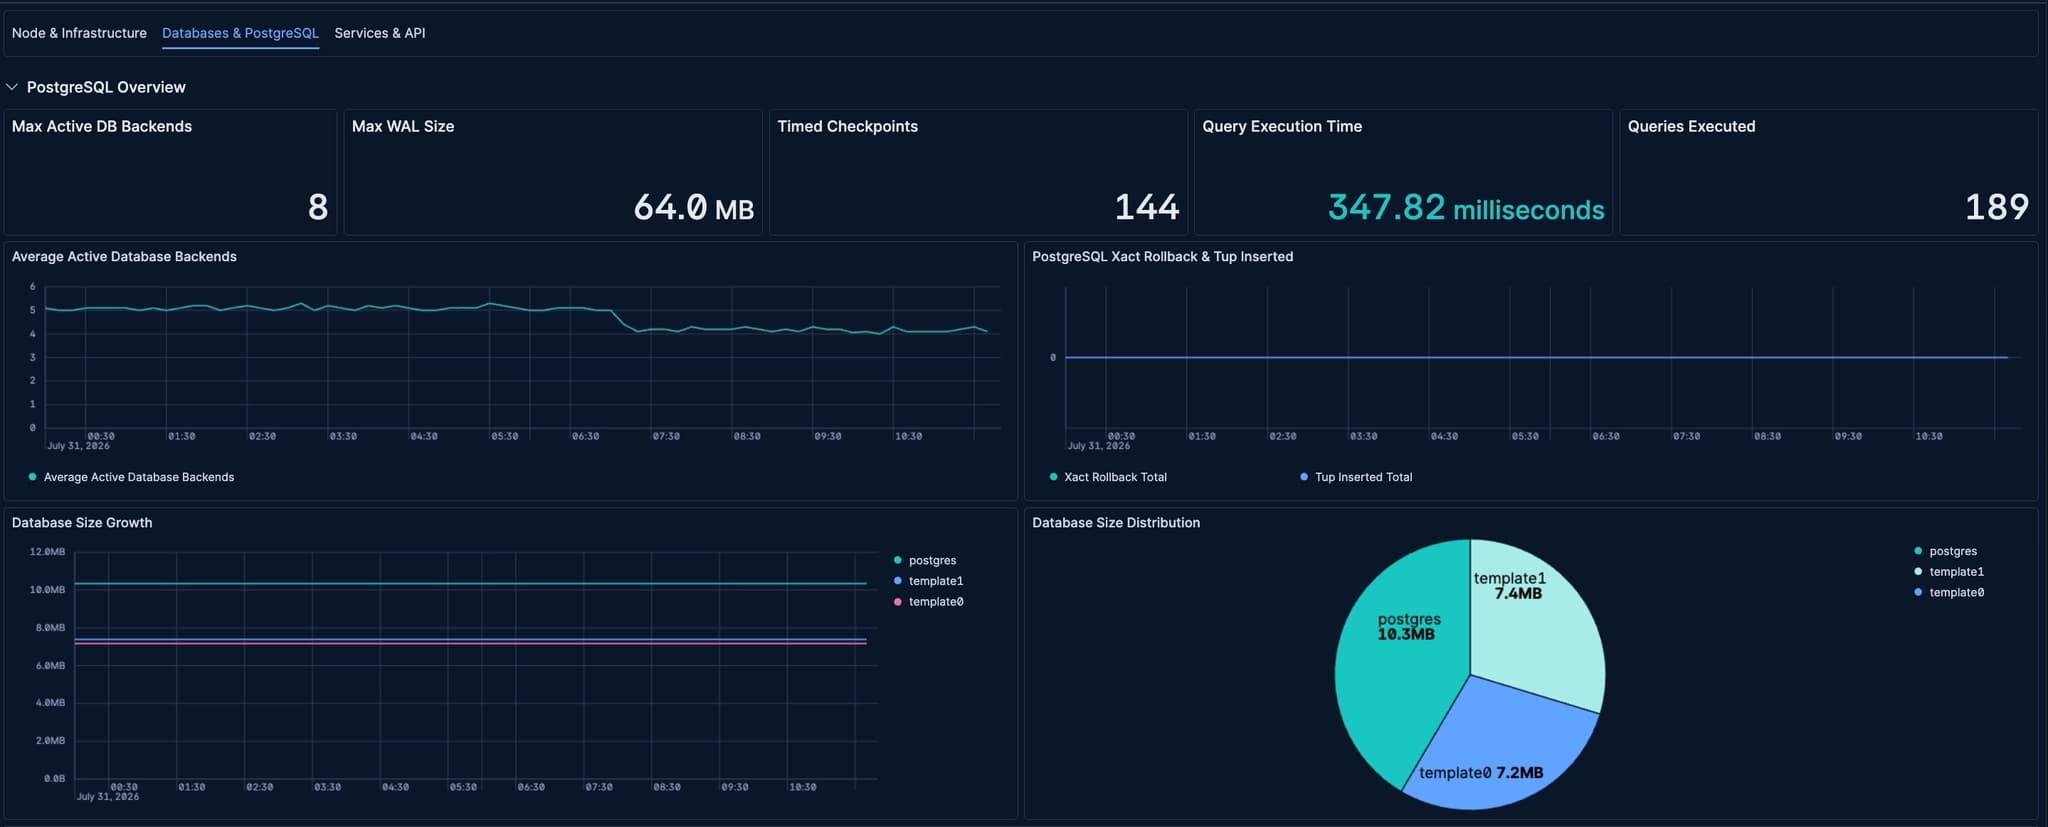
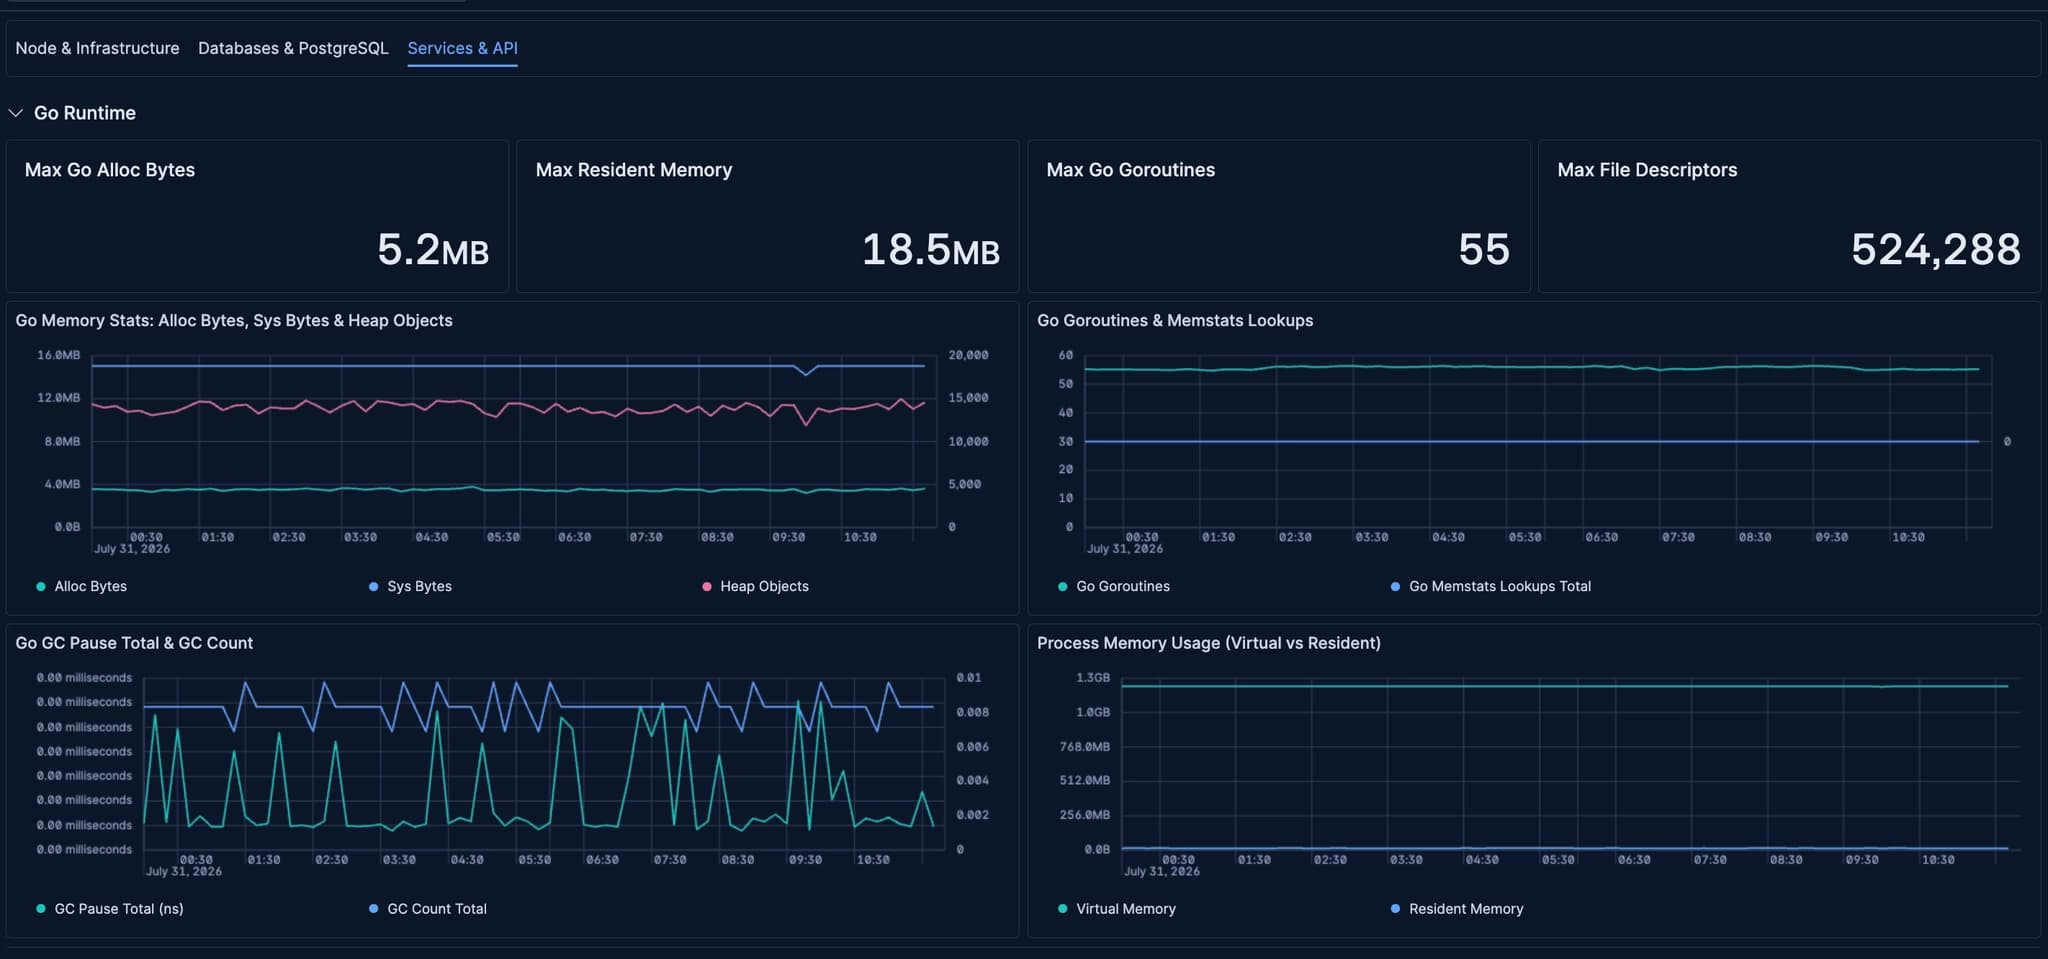
Once connected, you get metrics for infrastructure health (CPU, memory, disk I/O), PostgreSQL query performance and connection activity, Supavisor pool utilization, PostgREST request and error rates, GoTrue authentication events, Realtime channel activity, and Storage operations, with structured logs landing in the same data store for correlated troubleshooting. Elastic ships out-of-the-box Kibana dashboards for each Supabase service layer, pre-configured alert rules for common failure patterns, and SLOs for key Supabase services that you can customize to match your own reliability targets.
Key features
- Metrics via the OpenTelemetry Prometheus receiver, no additional agent required
- Structured log ingestion via OpenTelemetry across all Supabase service layers
- Infrastructure monitoring: CPU, memory, and disk I/O
- PostgreSQL: query statistics, transaction rates, connection counts, and vacuum activity
- Supavisor: connection pool utilization, client connections, and checkout wait times
- PostgREST API: request rates, response times, and error rates
- Auth (GoTrue): login events, token operations, and authentication error rates
- Realtime: channel connection counts and message throughput
- Out-of-the-box Kibana dashboards for every Supabase service layer
- Pre-configured alerts for common failure patterns, ready to use or customize
- SLO management for Supabase services, included out of the box
Details
Third-party integrations and docs are managed by Supabase partners.