Overview
Grafana Cloud is an AI-powered, full-stack observability platform that helps you improve the reliability of your applications, resolve incidents quickly, and optimize your telemetry to reduce noise and costs. With the Grafana Cloud integration for Supabase, you can bring production-grade observability to your projects, gaining deep visibility into performance, system health, and database metrics.
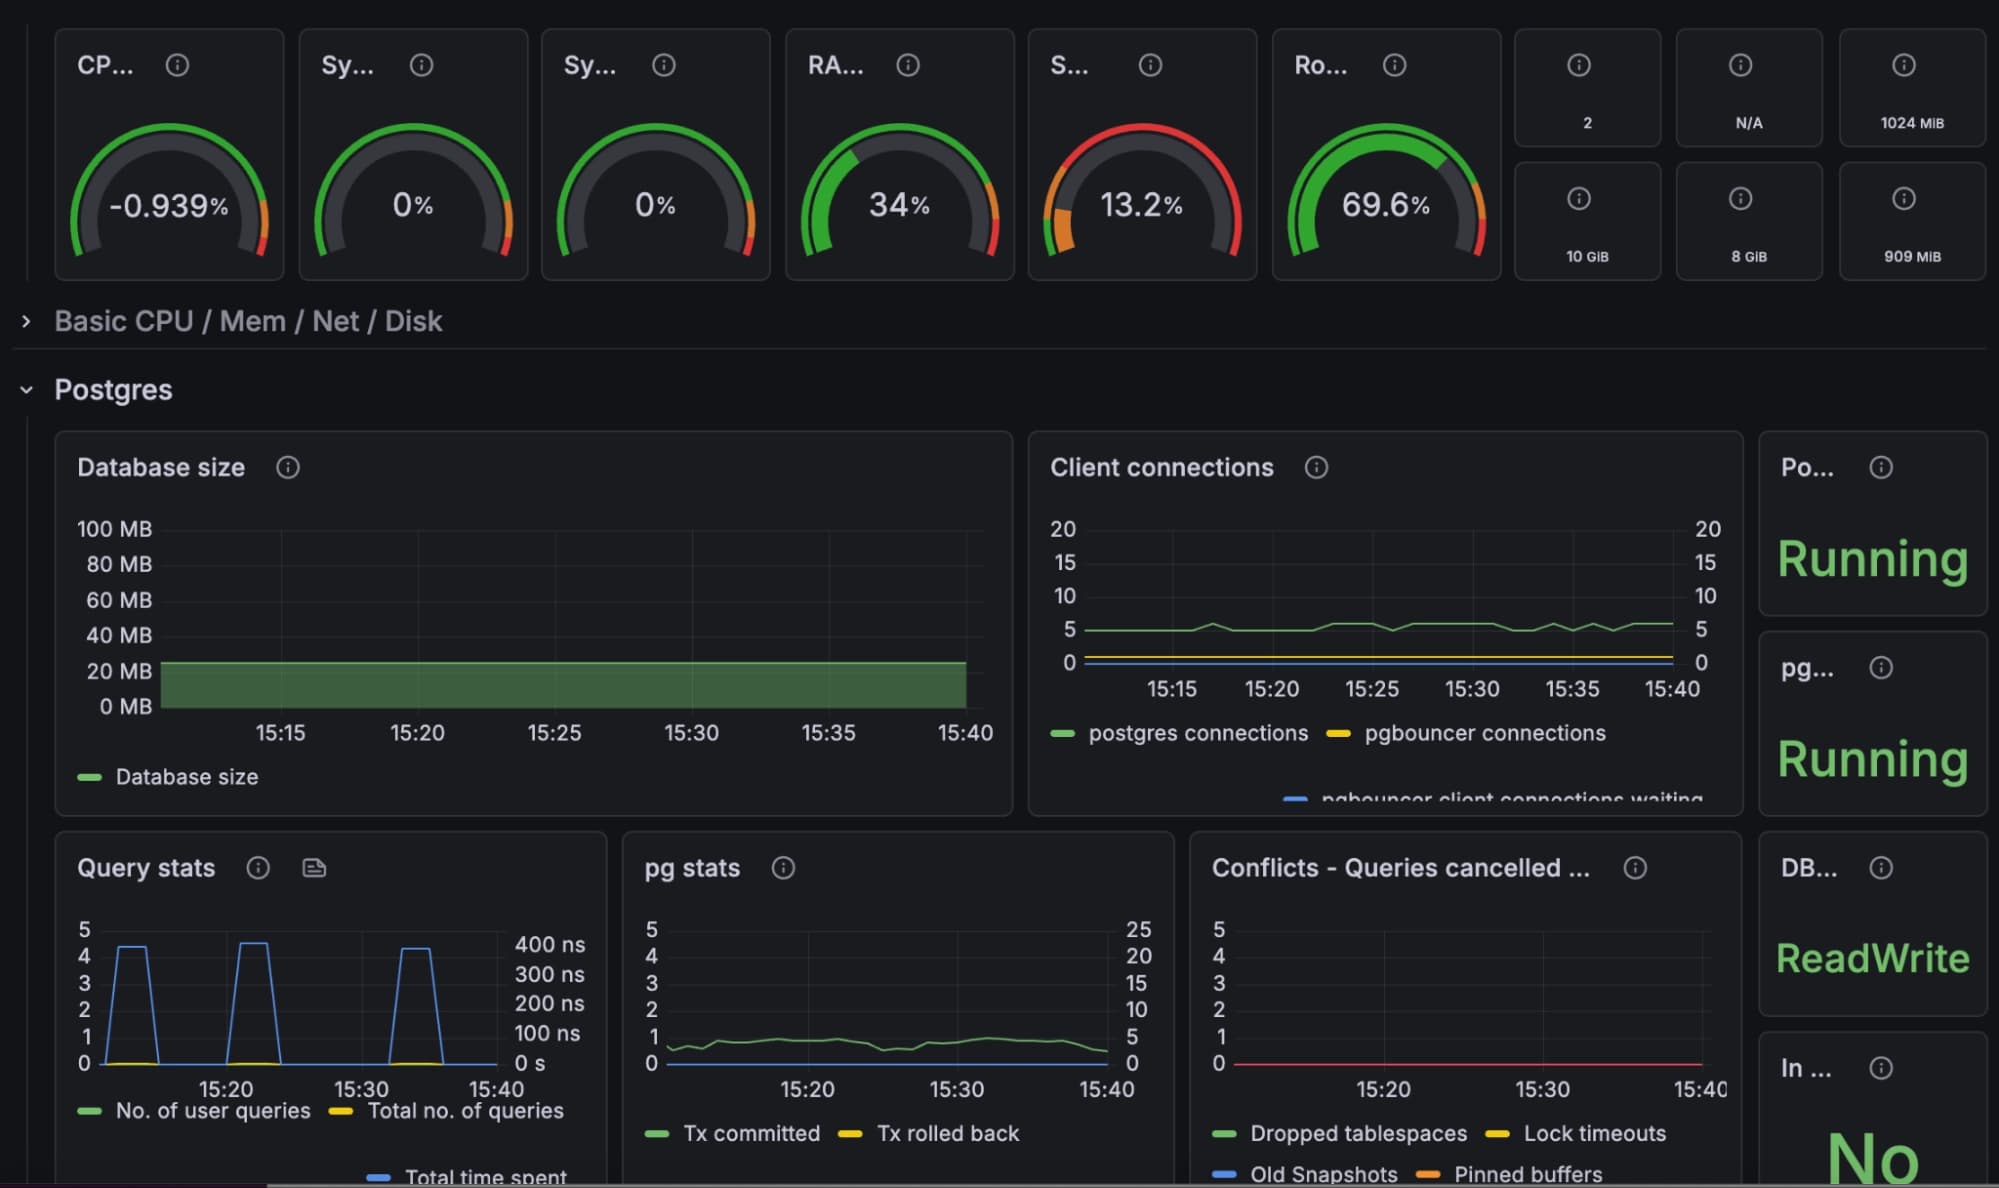
Once connected, a fully-configured Grafana Cloud instance is provisioned with authentication, metric scraping, and a pre-built dashboard already set up in your workspace on arrival. Grafana Assistant is built in for dashboard creation, alerting, and incident troubleshooting.
The integration reads from the Supabase Metrics API using Prometheus exposition format, scraping roughly 200 metrics at one-minute granularity across:
- CPU and memory pressure
- Disk IO and throughput
- Network traffic
- Connection counts and pooler behavior
- Replication lag
- Scheduled and requested checkpoints
- Database size, query stats, and index health
Available on every plan, including free.
Details
Third-party integrations and docs are managed by Supabase partners.